Real Estate Market Crash: Insights from an Industry Veteran

A real estate market crash is a sustained decline, not a temporary price dip, and the clearest historical pattern combines collapsing transaction volume, distressed seller behavior, and tightening credit. In the 1920s U.S. housing bust, annual deed recordings fell 64.8% from the 1925 peak to the 1933 trough, while the median house-price decline reached 31.0% between 1925 and 1933–34 (NBER historical analysis).
You may be feeling the tension already. Your home's estimated value looks stable, but buyers are taking longer to commit, listings sit through multiple weekends, and your lender is asking more questions than expected. Investors face the opposite problem: promising properties appear available, yet financing costs, insurance, taxes, and uncertain rents make a purchase harder to underwrite.
That gap between headline prices and day-to-day conditions creates unnecessary fear. Richard Maize has spent over 30 years in mortgage banking, real estate, finance, and investment, and his experience offers a useful way to separate ordinary cooling from genuine structural danger. A market can become difficult without becoming a crash. The practical task is to identify which mechanism is changing, then protect liquidity and cash flow before emotion takes control.
Defining the Real Estate Market Crash
A homeowner may see the warning first in a stalled sale. A buyer withdraws after financing fails, a lender tightens its terms, or an investor discovers that insurance, debt service, and projected rent no longer support the purchase. Each event can occur during a normal slowdown. A crash develops when these pressures persist and spread across transactions, credit, inventory, and borrower behavior.
A correction is usually a repricing of expectations. Prices may flatten or fall in selected neighborhoods while credit remains available, employment holds reasonably steady, and sellers can still complete transactions without widespread distress. A real estate market crash involves a broader breakdown, typically combining falling prices, sharply reduced sales, forced or distressed selling, rising defaults, and lenders that restrict new credit.
Richard Maize's experience helps separate those conditions from daily market noise. His official FAQ describes more than three decades in real estate and finance, including the creation of a mortgage banking firm and later work in property holdings, venture capital, and media. That background keeps financing at the center of the diagnosis. Property values matter, but the ability to fund, refinance, and close transactions determines whether weakness remains orderly.
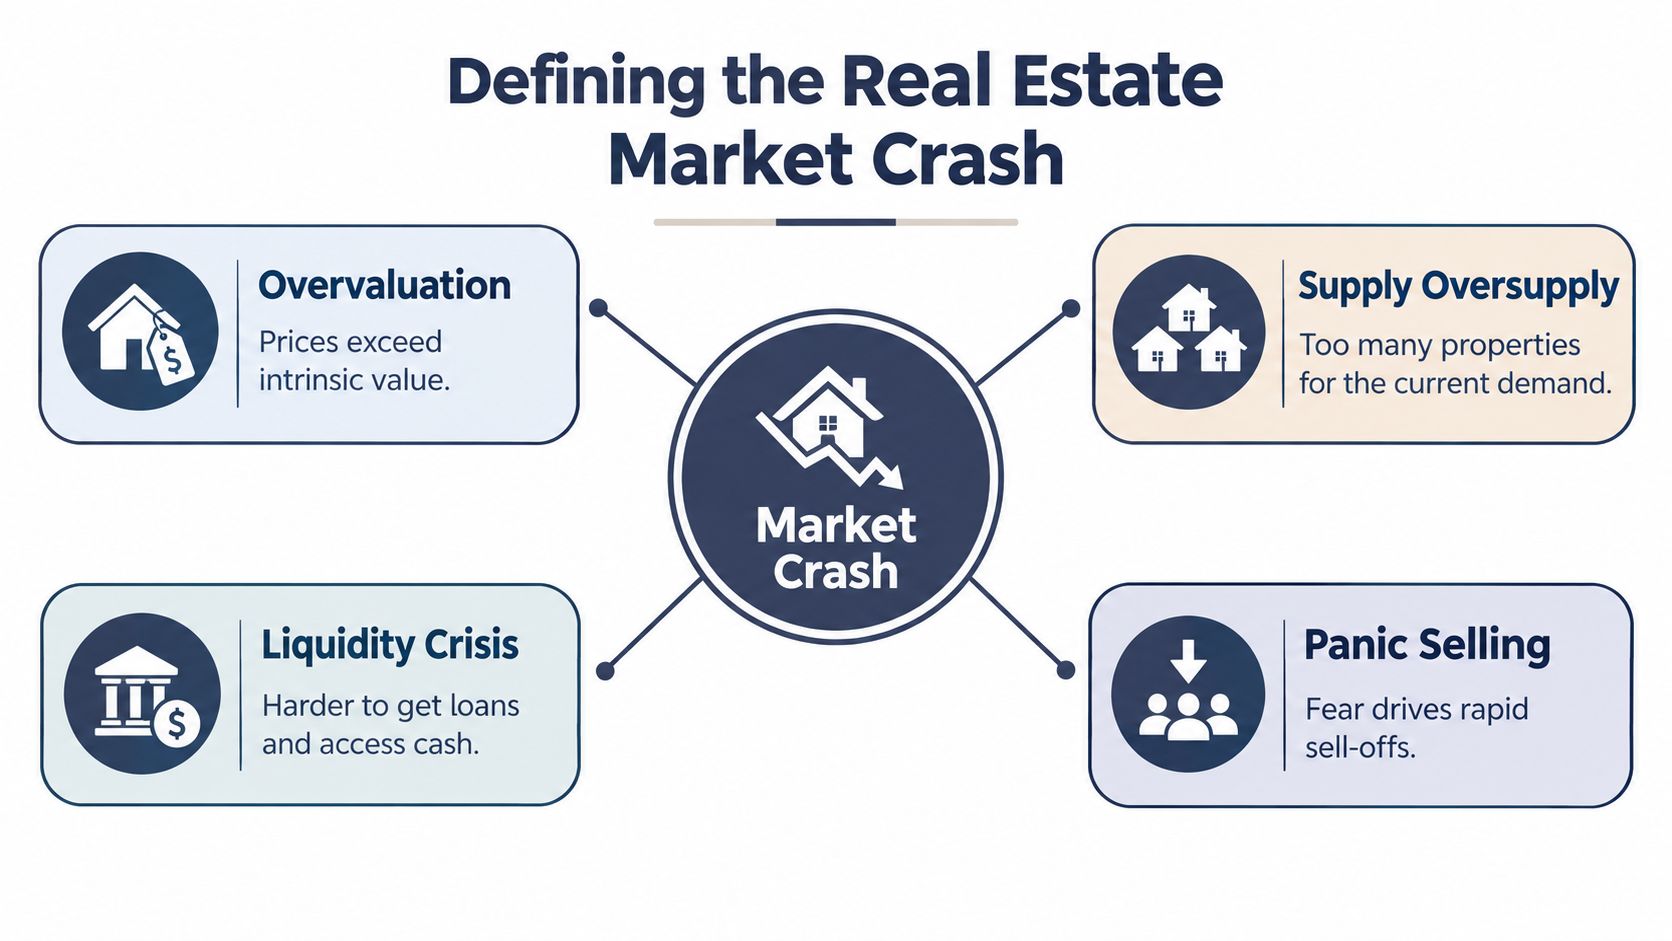
The four-part test
Use four conditions to test whether a downturn has structural force:
Overvaluation: Prices exceed what local incomes, rents, or property economics can support.
Oversupply: Homes or units exceed sustainable demand, giving buyers negotiating power and forcing sellers to compete.
Liquidity stress: Owners, developers, or lenders cannot refinance, sell, or raise capital on workable terms.
Panic selling: Participants sell to preserve cash, repay debt, or avoid foreclosure instead of maximizing value.
The interaction carries more risk than any single condition. Falling prices weaken collateral. Weaker collateral can make lenders cautious, reducing purchasing power and demand. That pressure may push additional owners to sell, while falling property values can also lower mortgage-backed securities, trigger margin calls, and force heavily invested vehicles to liquidate assets at distressed prices, as described in the OECD analysis of real estate finance.
Practical rule: Do not label every price decline a crash. Check whether transaction activity, credit access, and borrower stability are deteriorating together.
Warning Signs and Key Metrics to Watch
A market downturn usually gives off measurable signals before prices break. Listings build, homes sit longer, sellers offer concessions, and lenders examine income and reserves more closely. One signal rarely settles the question. The useful work is comparing several indicators across the same market and time period.
Begin with inventory and market time. In July 2026, active U.S. listings rose 2.1% year over year to 1,126,252, while median days on market reached 57. New listings were flat year over year, according to Realtor.com July 2026 data. More listings combined with slower turnover generally point to softer demand, though they do not prove a national crash. Supply may remain limited in specific neighborhoods or price bands, letting sellers maintain prices while buyers become less urgent.
National price averages can also conceal meaningful differences. In June 2026, U.S. home values increased only 1.2% year over year, while median listing prices declined 2.5% year over year. Price per square foot fell in 33 of the top 50 metros, as reported in Realtor.com June 2026 data. An investor should therefore compare the local market, property type, condition, and recent comparable sales rather than rely on one national measure.
Cooling market or systemic break
A cooling market brings slower sales, greater negotiation, and flatter prices. A systemic break involves distressed borrowers, rapidly rising foreclosures, serious credit impairment, and a labor-market shock. Bankrate's housing analysis reported a national median sale price of $435,300 in June, inventory equal to 4.7 months of supply, and 187,659 U.S. homes with foreclosure filings in the first half of 2025, up 5.8% from a year earlier (Bankrate analysis). Those figures require context from employment, loan performance, and regional conditions.
Historical analysis from the IMF found that more than two thirds of nearly 50 systemic banking crises followed house-price boom-bust patterns. It also emphasizes housing's sensitivity to interest rates and credit availability (IMF housing and financial-crisis analysis). Higher mortgage rates can reduce affordability and weaken collateral values. The severity depends on borrower balance sheets, loan quality, and lender exposure.
Track four measures in each market:
Local inventory: rising supply matters more when sellers are also cutting prices.
Transaction volume: weak sales with stable prices may reflect an affordability freeze.
Foreclosure activity: distress becomes more dangerous when it spreads beyond isolated borrowers.
Credit terms: tighter underwriting can turn a manageable slowdown into a demand shock.
Richard Maize's analysis of interest rates and investor decisions provides practical context for financing sensitivity. The operating question is whether transactions, credit access, and borrower stability are weakening together, rather than whether one headline sounds alarming.
How Richard Maize Approaches Market Cycles
A property can look profitable until rents soften, vacancies extend, insurance rises, and a loan reaches maturity. Richard Maize evaluates that pressure as an operator managing exposure, not as a spectator predicting headlines. With more than 30 years in mortgage banking and real estate, including ownership across multiple markets, he brings a practical view of how local conditions affect portfolios. An Entrepreneur profile reports that he had accumulated 1,000 apartment units before age 30 and now owns property in 20 states.
That experience separates a genuine crash from the noise of an ordinary correction. A national forecast cannot determine whether one asset remains viable. The useful test is whether the property can absorb weaker rents, longer vacancies, higher insurance, delayed refinancing, or a lower resale value while still meeting its obligations.

A cycle checklist for owners
Before purchasing, refinancing, or selling, review five areas:
Test operating cash flow. Recalculate income with conservative rents and realistic vacancy. Include taxes, insurance, maintenance, management, utilities, and capital repairs. A property that works only at perfect occupancy has little room for error.
Map the debt. Record the rate type, maturity, amortization, prepayment terms, and refinancing requirements. A profitable asset can become a liquidity problem when its loan matures during restricted credit conditions.
Use local evidence. Review comparable sales, active listings, rental demand, employment, population movement, and nearby construction. Maize's real estate market analysis template organizes these inputs around the asset rather than a single national prediction.
Check exit flexibility. Identify more than one workable path, such as holding, refinancing, selling, improving the property, or changing its use. Flexibility matters when market timing becomes unreliable.
Protect liquidity. Keep accessible capital for repairs and unexpected vacancy. Equity cannot pay a bill until a lender or buyer converts it to cash.
A resilient portfolio is one that keeps operating while a decline runs its course.
If rents remain dependable, debt is manageable, and local demand holds, a lower valuation may be uncomfortable but survivable. If cash flow weakens while refinancing disappears and forced sales increase, preserving capital takes priority over expansion.
Lessons from Past Housing Busts
A market can look calm while its exit routes narrow. That distinction matters in Richard Maize's work across more than 30 years of mortgage banking and multi-state real estate. He separates a genuine crash, where credit stress and forced selling spread, from an ordinary correction that mainly reduces transaction volume or slows price growth.
History offers two practical warnings. Housing downturns can outlast public attention, and stress may appear in transactions, lending, and confidence before prices show a dramatic break.
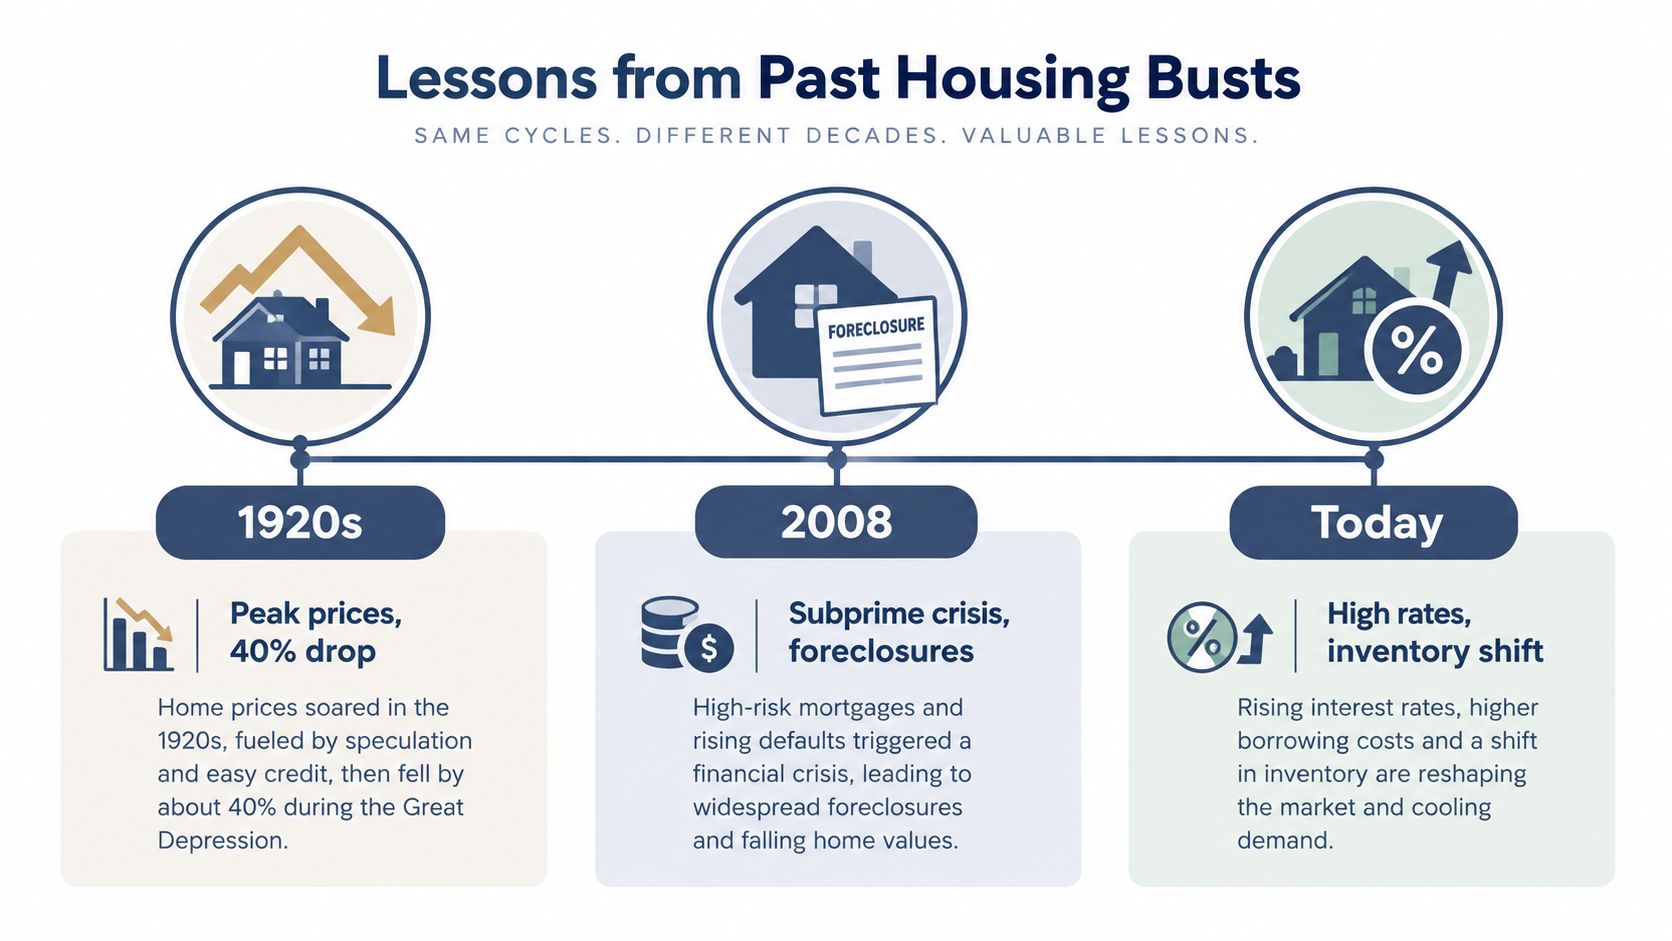
The 1920s U.S. housing boom illustrates a prolonged decline. A broad sales-volume measure peaked in 1925 and fell each year from 1926 through 1933. Annual deed recordings dropped 64.8% from the 1925 peak to the 1933 trough, while the median house-price decline reached 31.0% between 1925 and 1933–34. Average house value fell from $6,619 in 1930 to $4,439 in 1934, a decline of 32.9% (NBER housing history).
What the 2000s added
The 2000s bust showed how housing finance can carry local losses into the wider financial system. The St. Louis Fed identifies the episode as running from 2000:Q2 to 2006:Q1, with a measured size of 50.78 and duration of 35 quarters. National home values fell roughly 25% to 30%, some markets lost more than 50%, and a historical analysis linked the 2008–2009 stock-market crash to a 57% equity decline (St. Louis Fed analysis).
The recurring mechanism is broader than falling prices. Fewer transactions and tighter credit can prevent owners from refinancing or selling, while debt-funded demand leaves the economy more exposed during a downturn, as earlier IMF research found.
Current conditions can feel frozen without matching a nationwide crash. Redfin reported July 2026 U.S. home sales at their lowest level in nearly two years, while the median sale price remained $407,730, up 3.2% year over year (Redfin data cited by Realtor.com). For Maize, that pattern signals affordability pressure and uneven demand, not proof of a uniform collapse.
Strategic Defense for Homeowners and Investors
A real estate downturn becomes dangerous when an owner loses the ability to choose. After more than 30 years in mortgage banking and multi-state real estate, Richard Maize has seen the difference between a genuine crash and an ordinary correction. Prices may pause or retreat without creating a crisis. Forced selling begins when weak cash flow, high debt, and limited liquidity remove every practical alternative.
The first defense is liquidity supported by dependable cash flow. Speculation depends on a future exit price. Risk management depends on the ability to hold, repair, refinance, or sell without accepting the worst available terms.
Homeowners should run a household stress test before market pressure rises. Could the budget absorb reduced income, higher insurance, an urgent repair, or a delayed sale? If not, reducing avoidable debt and keeping accessible savings may provide more protection than stretching for a larger home or pursuing a riskier investment.
Investors need the same discipline at the property level. Underwrite each asset as though the next lender and buyer will be more cautious. Use conservative rent assumptions, verify operating expenses, and review loan maturity dates before adding debt. A property that survives weaker conditions deserves more attention than one that works only with rising prices.
What works under pressure
Cash reserves: Accessible funds buy time. Time can prevent a forced sale and allow a sound property to recover.
Measured debt usage: Debt can increase returns during expansion, but it also increases payment risk when values fall and refinancing becomes harder.
Durable operations: Properties supported by steady demand and understandable expenses are easier to manage than assets dependent on aggressive appreciation.
Staged decisions: Do not sell everything because a headline is alarming. Rank assets by cash flow, debt risk, location, and strategic value, then address the weakest position first.
Documented alternatives: Contact lenders before a maturity problem becomes urgent. Restructuring, an asset sale, or operational improvements may remain possible while there is still time to negotiate.
Liquidity is not wasted capital. An investor who commits every available dollar may look fully invested, yet have no way to handle vacancy, repairs, taxes, or revised loan terms. Homeowners face a similar risk when they treat equity as immediate protection. Equity has value, but it cannot pay a bill unless a buyer or lender provides an exit.
Cash-flow principle: A lower-return property that can withstand stress is often safer than a higher projected return built on perfect assumptions.
Collateral and funding spirals explain why debt requires close attention. Falling values can reduce available collateral, pressure securities, trigger margin calls, and force debt-heavy owners to sell into weakness, as described in the OECD real estate finance report. Defensive planning interrupts that chain by limiting forced decisions before prices become distressed.
Opportunities Amid Market Volatility
A falling appraisal does not force the same decision on every owner. A reactive seller may accept the first offer that restores certainty. A prepared investor compares the asking price with sustainable property economics, then tests whether the discount reflects a real opportunity or hides operating, financing, or location risk.
Preparation creates the difference.

Reactive selling versus deliberate buying
Reactive seller | Strategic investor |
|---|---|
Responds to headlines and recent price movement | Underwrites income, expenses, debt, and local demand |
Accepts a discount to regain certainty | Uses available cash to negotiate terms and timing |
Treats every market as identical | Separates neighborhoods, property types, and financing structures |
Prioritizes speed over survivability | Prioritizes durable cash flow and downside protection |
A lower purchase price does not automatically create value. A distressed building may require major capital, face weak tenant demand, or carry debt that cannot be replaced on workable terms. A sound opportunity has an understandable reason for its discount and a credible path to stable operations.
Current conditions reward patience. Zillow forecast U.S. home values to finish 2026 roughly flat to slightly down at -0.2%, while active listings were increasing and median days on market had lengthened. That combination can create more room to negotiate without producing the dramatic nationwide collapse some buyers expect. Sellers with limited competing supply may hold firm, while buyers can seek better inspection terms, financing conditions, and closing timelines.
The practical test is simple: can the property still function if the optimistic assumption fails?
Look for stable local demand, manageable debt, and repairs that can be priced with reasonable confidence. A property that works only if rents surge or borrowing costs fall belongs on the watchlist, not in the acquisition pipeline.
Richard Maize's discussion of why market volatility is not automatically a crisis reflects a distinction developed through more than 30 years of mortgage banking and multi-state real estate work. Ordinary price movement changes negotiations. A genuine crisis impairs the ability of owners, borrowers, and lenders to function.
That distinction helps investors avoid confusing activity with opportunity.
Keep capital available, maintain a written acquisition standard, and set a clear limit for acceptable downside. When the numbers work without heroic assumptions, act decisively. When they do not, patience protects capital and preserves future choices.
A market review with Richard Maize can help assess financing, local demand, cash flow, and exposure to the cycle rather than relying on headlines alone. Visit Richard Maize for his real estate perspectives, investment work, and practical resources. Use that framework to stress-test the next property decision before committing capital.
Comments