Real Estate Market Analysis That Actually Works

More data doesn't automatically produce a better real estate market analysis. It often produces a thicker spreadsheet, a false sense of precision, and an investor who still can't answer the only question that matters: should I buy, sell, hold, or walk away?
Richard Maize's career offers a useful practitioner's lens. He's described as a Los Angeles-based real estate investor, entrepreneur, and philanthropist with over 30 years of experience in real estate and finance (Richard Maize). Independent profiles and Maize-affiliated biographies state that he accumulated nearly 1,000 apartment units before age 30 and later owned property across 20 states (Maize's professional profile). Those facts don't make every investment decision for you, but they point toward a disciplined habit: use analysis to decide, not to decorate a workbook.
Why Most Real Estate Market Analysis Misses the Point
A spreadsheet can contain every familiar market metric and still produce a poor investment decision. Investors often download reports, collect cap rates, compare absorption, copy inventory figures into a model, and add tabs until the deal appears thorough. The missing step is deciding which outcome those numbers are meant to test.
A real estate market analysis works best as a decision filter. Each important input should support one of three calls:
Buy: The evidence supports the price, business plan, and risk.
Hold: The asset or market may work, but the current terms do not justify action.
Pass: A structural weakness makes the opportunity unattractive, even after cosmetic improvements.
A metric that cannot change one of those calls belongs in the archive, not at the center of the underwriting model.
Start with the decision
Define the decision before opening Excel. Are you assessing a rental purchase, selecting a metro for future investment, pricing a sale, refinancing an existing asset, or waiting for better terms? Each question requires a different set of evidence.
For a stabilized apartment building, rent durability, operating expenses, financing, and exit liquidity may carry the most weight. A developer needs closer analysis of competing supply, zoning, infrastructure, and lease-up risk. A seller needs a credible view of buyer demand and competing inventory. A national forecast rarely answers that property-level question.
Practical rule: If you cannot state what action a metric could change, do not give it equal weight in the analysis.
More inputs can weaken judgment
Headline scale also requires context. MSCI estimates that commercial property managed by institutional investors for investment returns reached USD 13.5 trillion in 2025 (MSCI's global real estate market size research). That figure describes the size of an investable market, not the liquidity, pricing power, or rent support of a specific neighborhood.
The same caution applies to transaction activity. Deal value tracked in 2025 rose to USD 873 billion, up about 12% year over year, while transaction count remained broadly flat. Larger transactions can lift total value even as ordinary buyers retreat and local liquidity weakens.
The practitioner's approach is narrower: identify the few variables that could reverse the buy, hold, or pass decision, then test those variables against property-level evidence. Completeness looks professional in a workbook. Relevance is what protects capital.
The Layers That Make Up a Real Market Analysis
A useful analysis narrows from market conditions to the asset itself. Each layer answers a decision question. Skip one, and you may mistake a broad trend for property-level support.

Begin with the economic backdrop
Start with the conditions that shape financing and employment. Track interest-rate direction, employment, migration, credit availability, and broader economic stress. The objective is not to predict the next policy move. It is to test whether the property still works if debt costs rise or demand weakens.
Long-run U.S. housing data shows why financing cannot be separated from prices and sales. Existing-home median prices fell from USD 198,600 in 2008 to USD 166,100 in 2011, while existing-home sales declined from 4.91 million to 4.26 million and the average 30-year mortgage rate fell from 6.03% to 4.45% (Housing Almanac's median price, sales, and mortgage rate history). Later, median prices reached USD 347,500 in 2021 and USD 399,200 in 2022, while mortgage rates rose to 5.34% in 2022 and 6.81% in 2023. Prices, sales, and borrowing costs interact, so no single variable gives you a reliable verdict.
Narrow to the metro and submarket
At the metro level, examine job creation, population movement, rental demand, wage conditions, and major-employer concentration. Then narrow again. One metro can contain neighborhoods with very different demand, supply constraints, and construction exposure.
Submarket research should answer four practical questions:
Supply pipeline: Which approved, active, or proposed projects could compete with the asset?
Demand profile: Which tenant or buyer groups can realistically afford it?
Location friction: How do commutes, school boundaries, zoning, crime conditions, and services affect demand?
Public investment: Could roads, transit, parks, or other infrastructure change desirability?
These signals matter only when they can alter your buy, sell, or hold decision. A large job-announcement headline means little if the jobs are distant from the property or do not support its rent level.
Finish at the property level
After the broader conditions support the thesis, test comparable sales, physical condition, unit mix, renovation scope, taxes, insurance, and unit-level economics. Comparable sales establish what similar assets traded for. They do not validate projected rent growth or an assumed exit price.
A comparable sale is evidence of a transaction, not a guarantee of your investment thesis.
Physical differences must change the assumptions. A building with dated interiors, awkward layouts, deferred maintenance, or poor access should not receive the same underwriting as a renovated competitor merely because both appear within the same search radius. The analysis earns its place when each layer supports a specific decision and the property can withstand the assumptions above it.
Key Metrics That Actually Drive Investment Decisions
A metric matters when it answers a question that can change your action. The best underwriting pairs indicators rather than treating one attractive number as a verdict.
Cap rate describes the relationship between a property's net operating income and its price. It also reflects how the market prices perceived risk. A lower cap rate can signal stronger demand, better liquidity, or lower perceived risk. It can also mean you're paying aggressively for those qualities. A higher cap rate may compensate for operational, locational, or financing risk rather than represent a bargain.
Gross rent multiplier is a fast screening tool. Divide the purchase price by gross scheduled rent to compare opportunities quickly. It ignores expenses, vacancy, and capital needs, so it's useful for eliminating obviously weak deals, not approving strong ones.
Cash-on-cash return connects annual pre-tax cash flow to the equity invested. Use the actual loan terms, including interest rate, amortization, reserves, and fees. A projected return based on favorable financing that you can't obtain is not analysis. It's wishful thinking.
Match each metric to its question
Metric | Question It Answers |
|---|---|
Cap rate | What level of income yield and market risk is embedded in the price? |
Gross rent multiplier | How does the price compare with gross rental income at a screening level? |
Cash-on-cash return | What cash flow does the invested equity produce under actual financing terms? |
Absorption rate | Is demand taking available space or housing at a pace that can support new supply? |
Months of supply | How much listed inventory exists relative to the current pace of demand? |
Price per square foot | How does pricing compare with genuinely similar properties in the same submarket? |
Rent-to-income ratio | How much affordability runway remains before renters resist further increases? |
Absorption helps resolve the tension between supply and demand. A market can show rising rents and still be vulnerable if new inventory is arriving faster than tenants can absorb it. Conversely, limited construction may support pricing even when broader sentiment is weak.
Months of supply and inventory trends provide context for pricing power. Buyers usually gain advantage as available inventory builds, while sellers typically gain advantage when suitable options remain scarce. Read the trend alongside days on market, concessions, cancellations, and the quality of available listings.
Price per square foot needs submarket adjustment. A metro average can conceal differences in building age, school boundaries, transit access, lot utility, and renovation quality. Compare like with like, and don't use a polished new project to justify the value of an older asset without an explicit adjustment.
Rent-to-income identifies the ceiling. If rents already consume too much of a household's practical budget, a rent-growth projection may be mathematically possible but commercially unrealistic. Pair affordability with absorption, vacancy, and wage conditions. The combination tells you whether demand has room to grow or is being priced out.
Reading Local Submarkets Instead of National Headlines
National headlines are useful for context, but they're poor substitutes for neighborhood-level judgment. A broad market can look balanced while a specific price band loses both inventory and buyer engagement. Realtor.com's 2026 housing alignment analysis describes that unevenness in the U.S. market, with the entry-level tier facing contracting supply and engagement as price-sensitive buyers are pushed out (Realtor.com's 2026 housing alignment analysis).
That segmentation changes the question. Don't ask whether the market is hot or cold. Ask which buyers remain active, which tenants can still afford the product, and where supply is accumulating.
Segment the metro by investable behavior
A useful submarket map should include school quality, crime data, employer concentration, new construction, rent-to-price relationships, and historical volatility. You're looking for a location where demand has a durable reason to exist, not merely a recent price spike.
For example, one ZIP code might support a 5% cap rate, while a neighboring ZIP code trades at 3.5%. Those figures are illustrative decision inputs, not universal benchmarks. The difference may reflect stronger schools, lower perceived risk, better employment access, newer housing, or more aggressive buyer competition. Your job is to identify which explanation is real before assuming the higher yield is mispricing.
Indicator | National Headline Reading | Submarket Reality (Example) |
|---|---|---|
Mortgage rates | Financing is more expensive across the country | A high-income neighborhood may retain demand while an entry-level area loses qualified buyers |
Inventory | Supply appears balanced overall | One school district may have limited resale options while a nearby district carries competing listings |
Rent growth | Rents appear stable or rising | New apartment deliveries can pressure concessions in one corridor and leave another untouched |
Employment | National or metro employment looks healthy | A neighborhood dependent on one major employer carries concentrated downside |
Home prices | Prices rise in nominal terms | Inflation-adjusted pricing may be flat or negative, limiting real purchasing-power gains |
Global data reinforces the danger of reading nominal prices without purchasing-power context. Recent data summarized by the Housing Observatory show nominal prices increased in Q1 2025 and Q3 2025, while real prices were flat to slightly negative, and global real house prices fell 0.6% year over year by Q4 2025 (the Housing Observatory's global housing report). Nominal appreciation alone doesn't tell you whether buyers are becoming more capable of paying.
For a quick ranking, score each submarket against your investment strategy, then weight the factors that can damage the deal. Supply risk, employer concentration, affordability, and exit liquidity may deserve more attention than a minor difference in recent appreciation. You can explore location-specific context through Beverly Hills parks and recreation information, but treat amenities as one input, not proof of investment performance.
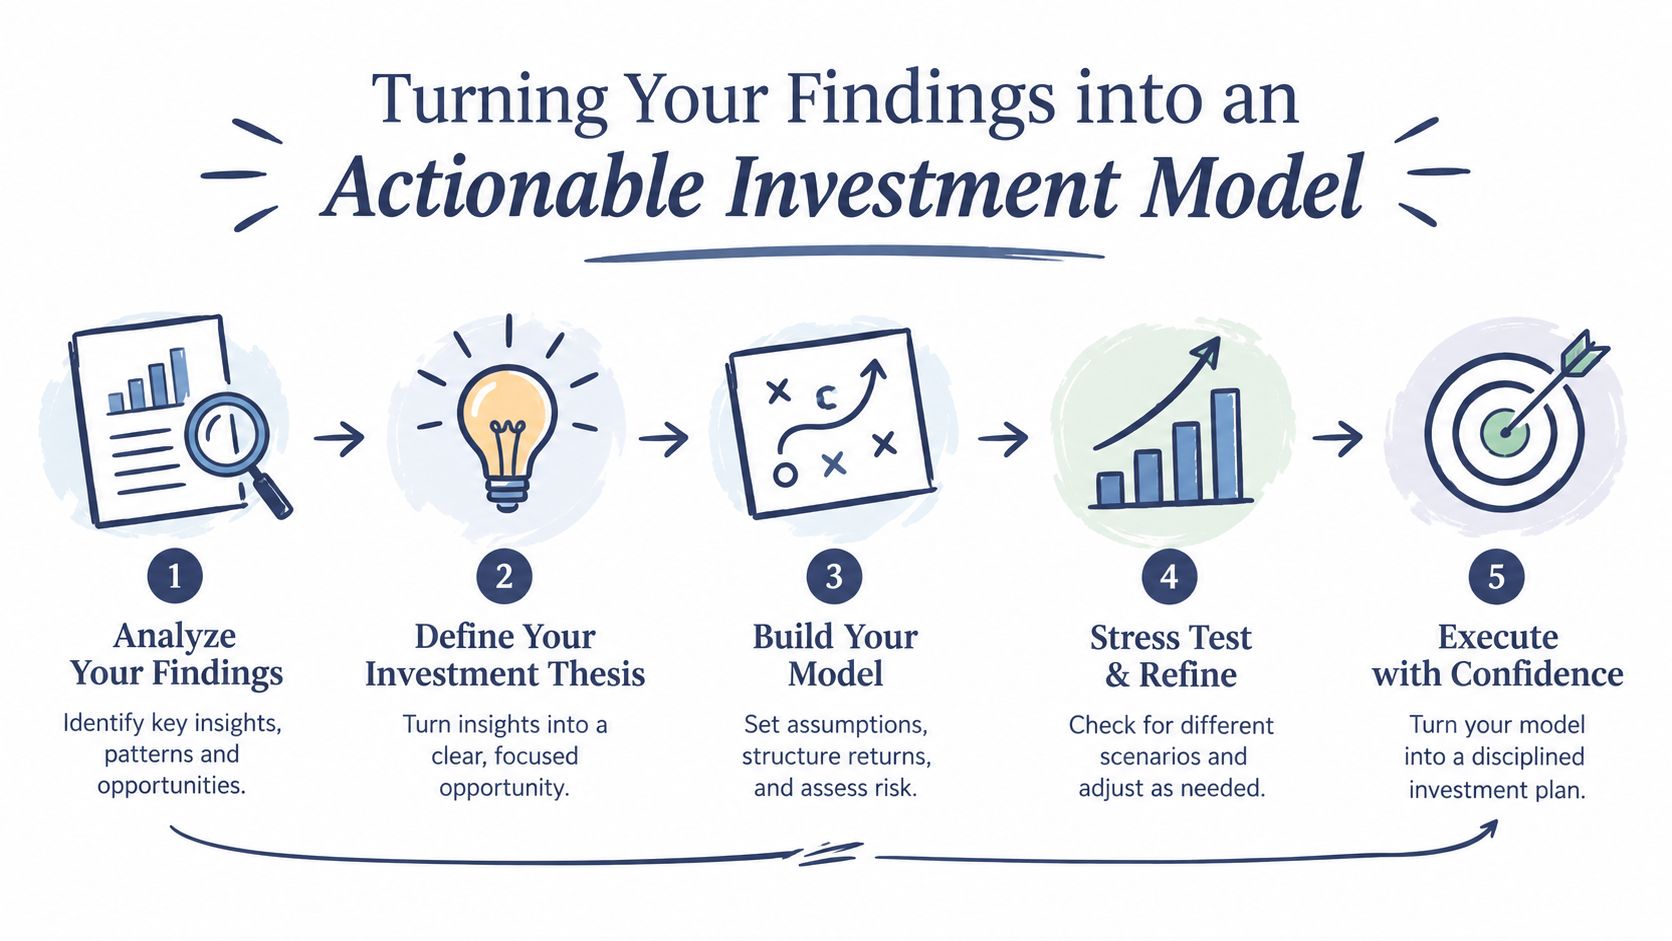
Turning Your Findings into an Actionable Investment Model
A practical model doesn't need to be elaborate. It needs to expose the assumptions that can break the deal and force you to define what “good enough” means before emotion enters the negotiation.
Start by writing target thresholds for cash-on-cash return, internal rate of return, and equity multiple. The exact threshold depends on your strategy, financing, risk tolerance, and alternatives. What matters is that you establish it before seeing the seller's urgency or falling in love with the property.
Build the minimum viable model
Use separate inputs for acquisition price, financing, rent, vacancy, operating expenses, reserves, capital improvements, and exit assumptions. Keep assumptions visible rather than burying them inside formulas.
A useful structure includes:
Revenue: Market rent, other income, lease-up assumptions, and realistic vacancy.
Expenses: Taxes, insurance, utilities, management, maintenance, reserves, and recurring capital needs.
Financing: Loan amount, interest rate, amortization, debt service, fees, and equity requirement.
Exit: Expected sale price, selling costs, holding period, and exit cap rate.
Returns: Cash flow, cash-on-cash return, IRR, and equity multiple.
Stress-test what you don't control
Run the model under weaker rent, lower occupancy, higher expenses, and a more expensive interest rate. Then examine a sensitivity table that changes two variables at a time. A 50-basis-point move in the exit cap rate can turn an attractive valuation into a marginal one, especially when the buyer depends on appreciation rather than current cash flow.
Pre-commit to exit criteria before underwriting. Decide what would trigger a sale, refinance, capital call, renovation pause, or change in management. If you wait until the property disappoints, you'll be tempted to redefine success to defend the original purchase.
Decision trigger: A model is finished when it tells you what to do after the assumptions move, not when every cell contains a formula.
Your final checklist should be short enough to use:
Buy trigger: The base case clears your return threshold, and the downside case remains survivable.
Hold trigger: Fundamentals work, but price or financing leaves insufficient margin.
Pass trigger: The deal requires optimistic rent, perfect occupancy, or an aggressive exit to succeed.
Review trigger: New supply, employer weakness, affordability stress, or financing changes invalidate a core assumption.
How Investors Act on Analysis Without Waiting for Certainty
Perfect information does not arrive before a good deal disappears. Disciplined investors decide which signals carry enough weight, set limits before bidding, and act when the probability-adjusted outcome fits those limits.
Institutional behavior offers a useful lesson without requiring institutional resources. Large investors define mandates, underwriting limits, approval rules, and risk controls before a property reaches committee. A smaller investor can apply the same discipline with a written bid rule: cap the purchase price at the value supported by a conservative exit-cap assumption, require adequate debt-service coverage, and reject the deal if renovation risk exceeds the reserve.
Put the rule on paper before reviewing the property. Set the financing limit, minimum coverage, acceptable renovation scope, and exit condition in advance. This prevents a compelling listing or competitive bidding process from changing the standards.
Replace certainty with weighted evidence
Waiting for one more data point can become a way to avoid commitment. Forecasts remain imperfect, comparable sales may be thin, and interest rates may not move as expected. Sellers adjust, competitors bid, and the opportunity changes while the analysis remains open.
Weight the evidence by its effect on the decision:
Strong support: Durable local demand, realistic affordability, manageable supply, and conservative financing.
Mixed evidence: Attractive current income paired with uncertain future supply or weak exit liquidity.
Structural concern: Dependence on aggressive rent growth, concentrated employment, or a valuation that works only under favorable rates.
A practical model should show the consequence of each concern. If the exit cap moves beyond the investor's preset limit, the maximum bid falls. If coverage drops below the financing requirement, the buyer changes the loan structure, adds equity, or passes. Those rules turn market analysis into an operating process rather than a collection of impressive figures.
The purpose of analysis isn't certainty. It's repeatability.
The same discipline applies to sell and hold decisions. A hold requires a fresh review of the original thesis, current market conditions, financing, and alternative uses for the capital. A sale does not automatically signal failure. If risk-adjusted returns have deteriorated, exiting may be the correct result of sound analysis.
The strongest market analysis ends with behavior. It identifies the evidence that matters, the threshold that changes the decision, and the action that follows. Richard Maize offers practical perspectives on real estate investing, business, and market conditions through his professional platform and published content. Visit Richard Maize to review his real estate market analysis resources and explore insights that can help turn market signals into clearer investment decisions.
Comments