Los Angeles Housing Market Forecast: What 2026 Data Shows

Richard Maize is a Los Angeles-based real estate investor, entrepreneur, and philanthropist who has built and managed a real estate portfolio for more than 30 years. The Los Angeles housing market forecast raises a practical question: do financing costs, rental income, and housing availability support a purchase without relying on future appreciation?
For buyers and investors, a forecast is most useful as a decision framework rather than a single price target. Approvals and permits signal possible future supply, while completed homes show what has reached the market. Those distinctions help assess whether a property's finances work under a range of conditions.
Los Angeles Housing Forecast Numbers at a Glance
The City of Los Angeles average home value is $926,192, down 0.8% year over year, while the county average is $870,656, up 0.2%, in the current-market readings accompanying the UCLA Anderson-affiliated forecasting project. Those opposing directions matter more than a broad claim that Los Angeles prices are rising or falling. A county average isn't a substitute for evidence about the property you're considering.
Time to pending also points to a split: approximately 33 days in the city versus 28 countywide. That's a measure of how quickly homes enter a pending transaction, not how long they take to close. It can help frame negotiation expectations, but it doesn't establish a discount for an individual listing.
Current readings and forecast ranges for Los Angeles
Indicator | Latest reading | Forecast or direction | Source type |
|---|---|---|---|
Average home value, City of Los Angeles | $926,192, down 0.8% year over year | Moderate, uneven change | Current market data |
Average home value, Los Angeles County | $870,656, up 0.2% year over year | Modest growth | Current market data |
Days to pending, city vs county | 33 days vs 28 days | City sales slower than countywide | Current market data |
Metro home-value growth | Model estimate, not an observed change | About 4.8% by August 2027, 80% range from -6% to +17% | UCLA Anderson-affiliated forecast |
Average county rent | $2,362 per month, June 2026 | Projected $2,469 by June 2029, about 1.4% a year | USC Lusk Center forecast |
County apartment vacancy rate | 5.6% | Projected decline to 4.87% | USC Lusk Center forecast |
The first rows describe reported market conditions. The remaining rows describe modeled outcomes, not promises. In particular, the home-value interval spans both losses and substantial gains, so the midpoint shouldn't become an automatic addition to an offer price.
The rental projections describe a different mechanism. Rent and vacancy should be read together because available apartments affect the alternatives a renter can realistically choose. Neither countywide measure tells you whether a particular building will lease quickly.
Turn averages into a property decision
Use comparable closed sales with similar property type, condition, location, and ownership costs. Then examine competing active listings to understand what buyers can choose today. Keep city and county figures as context rather than blending them into a supposed fair value.
For a local practitioner's perspective, Richard Maize's insights on navigating Los Angeles real estate provide a useful companion to that property-level analysis.
The defensible takeaway is flat to modestly positive headline conditions, with substantial local variation. Neighborhood evidence should change your offer more than the metro average does.
Why Construction Shortfalls Put a Floor Under Prices
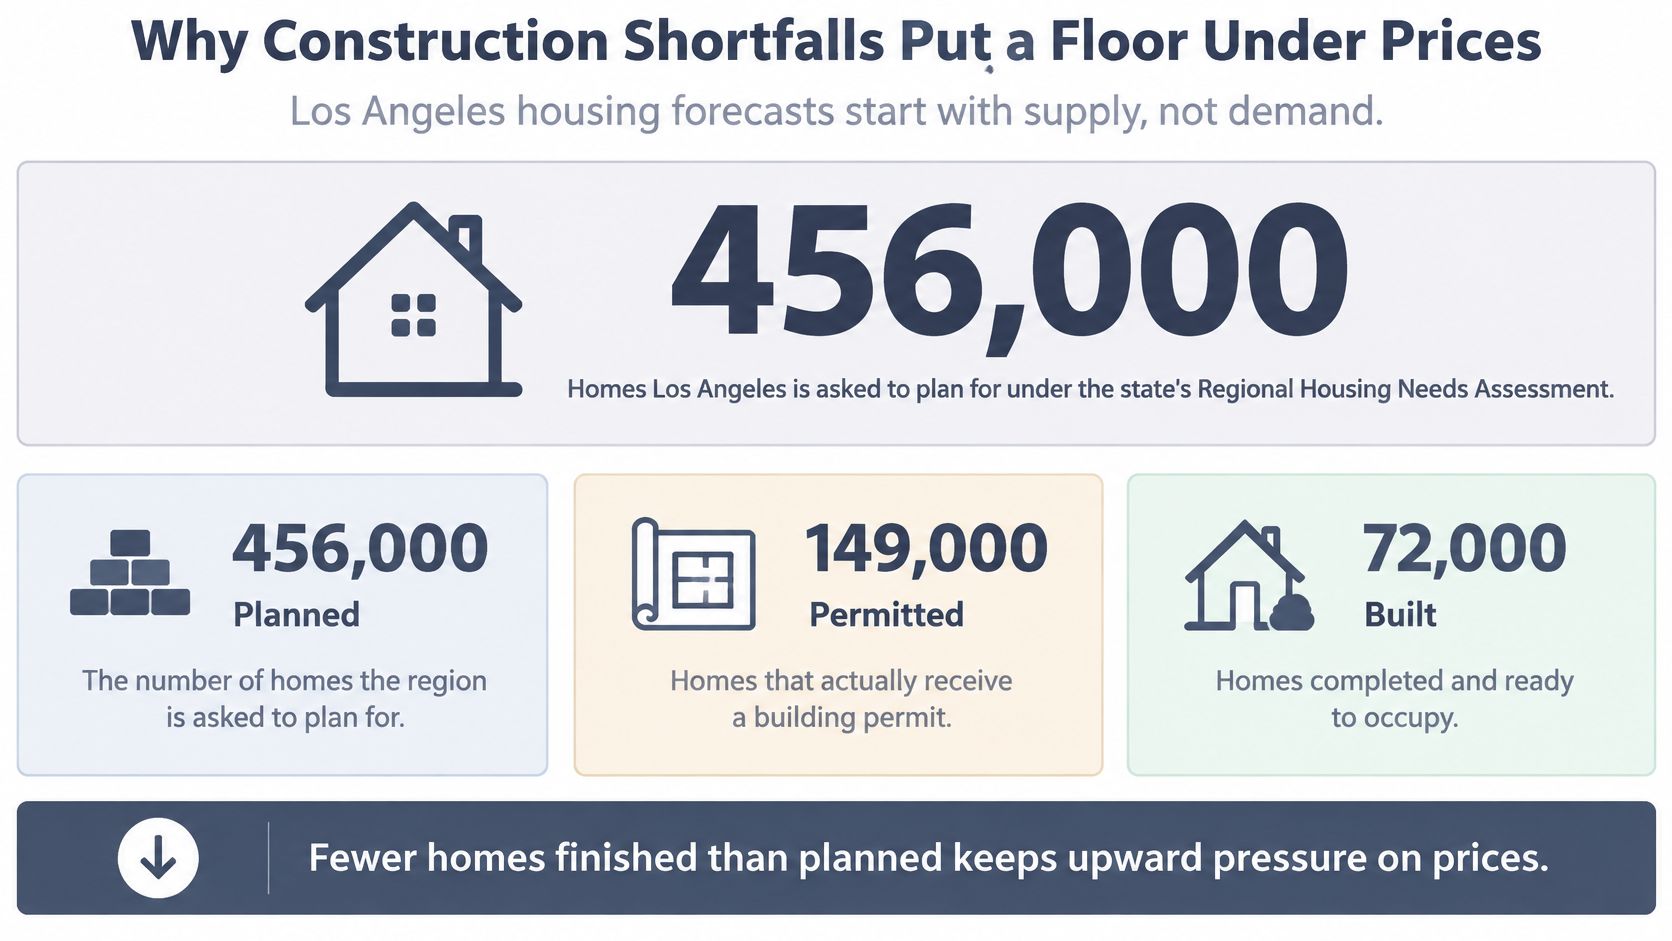
Los Angeles housing forecasts need a supply baseline before they can interpret changes in buyer demand. The state's Regional Housing Needs Assessment requires Los Angeles to plan for more than 456,000 additional homes between 2021 and 2029, roughly 57,000 annually, compared with about 18,000 units permitted in 2025, according to Realtor.com's review of homebuilding and affordability.
The same review reports that the city's permitting pace reached 28,500 units annualized by May 2026, while approximately 179,400 units were certified for occupancy countywide from 2018 through 2025. These measures describe different places, periods, and pipeline stages. They shouldn't be combined into a single completion rate.
Housing need versus what is actually built
Measure | Figure | Context |
|---|---|---|
Regional need, 2021-2029 | More than 456,000 homes | About 57,000 units a year |
Units permitted, 2025 | About 18,000 units | Well below the annual target |
City permitting pace, May 2026 | 28,500 units annualized | Still below the 57,000 target pace |
Countywide certified for occupancy, 2018-2025 | About 179,400 units | Eight years of completions combined |
The distinction between planned, permitted, and built housing is central to interpreting that gap.
A supply floor isn't protection from losses
A shortage can support long-term housing costs without preventing a buyer from overpaying. Higher borrowing costs can still reduce purchasing power, and an owner who must sell may accept less than expected. Structural scarcity and short-term price declines can coexist.
The important inference is conditional: if borrowing becomes cheaper before enough homes are completed, buyers can regain purchasing power faster than developers can deliver housing. That creates the potential for renewed competition. It doesn't establish when that competition will arrive or which properties will benefit.
Practical rule: Treat the housing shortage as context for a long holding period, not as insurance against a weak purchase price.
A stronger supply outlook would require sustained permitting closer to the planning benchmark, followed by actual delivery. An annualized permitting improvement isn't enough if developers can't finance or finish projects.
For a quarterly review, track completed units within the same jurisdiction against that jurisdiction's annual housing obligation. Use county completions as regional context, not as a direct measure of the city's progress. That geographic discipline prevents an apparently encouraging total from hiding a local shortage.
Reading Permits, Approvals and Completed Homes
Los Angeles City Planning reported a 30% quarter-over-quarter rise in proposed housing units in Q3 2025. That increase signals more activity in the pipeline, but it does not show how many homes will be built or when they will be ready.
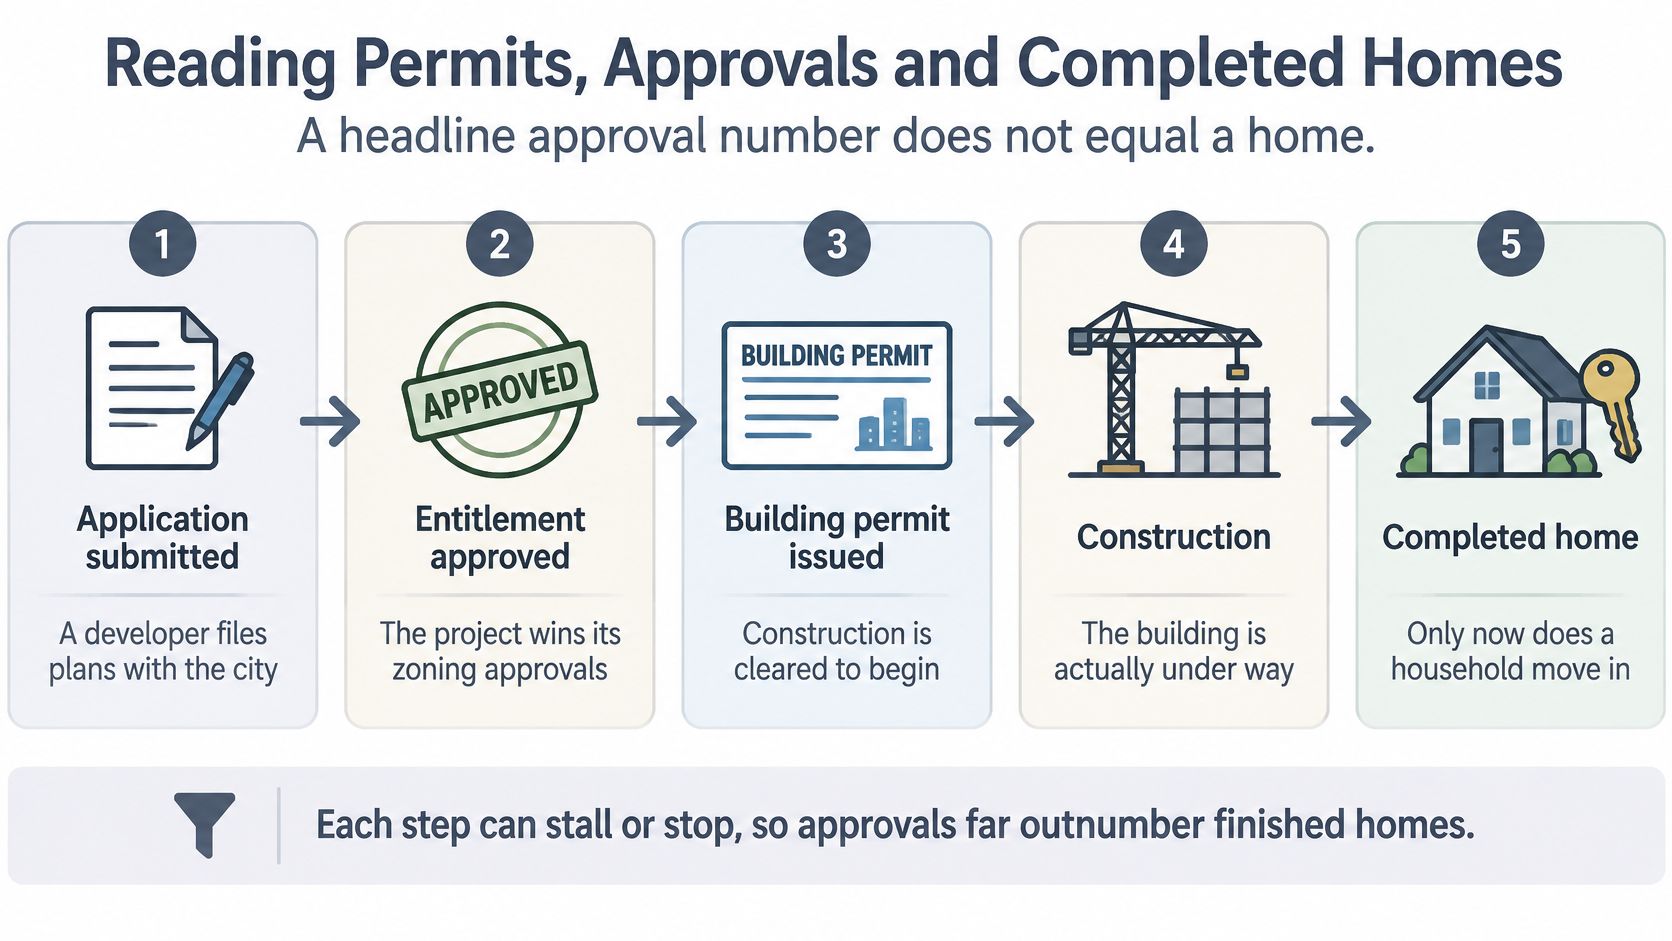
A project moves through distinct stages, each answering a different question about future supply:
Application submitted. Proposed unit counts can change as plans are revised or review requirements are addressed.
Entitlement approved. The approved use and unit count establish what zoning allows. They do not confirm financing or construction.
Building permit issued. A permit is stronger evidence of readiness than an announcement, but costs or financing can still delay work.
Construction started. Visible building activity indicates progress. Labor, infrastructure work, and contractor issues can affect timing.
Certificate of occupancy. Check how many units are cleared for occupancy. A partial completion does not deliver the project's full approved capacity.
First move-in. Occupancy shows that homes are reaching residents. It also indicates how quickly new units are being absorbed.
What the approval figures actually establish
The Fall Quarterly Housing Report reports that Los Angeles City Planning approved 10,408 total housing units across the reported period. Affordable units represented 48% of Q3 submissions and 64% of approved entitlements.
These figures describe proposals and approvals, not completed homes. Each stage answers a separate question: what has been proposed, what has permission to proceed, and what is available to occupy. Financing, construction costs, lawsuits, labor, infrastructure, or cancellations can still interrupt delivery. An approved project may affect a long-term neighborhood outlook while adding no near-term rental competition.
For an additional market discussion, the video below complements the project-stage checklist.
Match the supply count to the decision
A buyer assessing future neighborhood change should review entitlements and infrastructure plans. An investor estimating near-term leasing competition should focus more on buildings under construction or ready for occupancy.
Separate market-rate units from income-restricted units as well. Eligibility differs, so those homes do not compete identically with every existing apartment. The decision-relevant count is not just how many units have been approved, but which households can occupy them and at what stage of delivery.
Rent Growth and What Renters Should Expect
The rental baseline is moderate growth, not broad relief. A USC Lusk Center forecast places Los Angeles County average rent at $2,362 per month in June 2026, projecting $2,469 by June 2029, an increase of $107, about 4.5% over three years or approximately 1.4% annually, according to Our Weekly's coverage of the forecast.
That coverage also reports a projected apartment vacancy decline from 5.6% to 4.87%. Separately, it cites the 2026 Los Angeles County Affordable Housing Needs Report, which estimates 473,603 low-income renter households lack access to an affordable home and calculates that renters need $49.98 an hour, 2.8 times the city minimum wage, to afford an average asking rent of $2,599.
Keep the rent measures separate
The forecast's county average and the affordability report's average asking rent aren't interchangeable. Don't interpret the difference between them as an observed increase. They are different reported measures used for different analytical purposes.
Lower projected vacancy suggests landlords may face less pressure to reduce asking rents. However, a countywide vacancy forecast doesn't establish demand for an apartment with an inconvenient location, deferred maintenance, or an asking rent above competing listings.
Moderate rent growth can still make housing less affordable when a household's income doesn't keep pace.
Budget for the lease, not the average
Renters. Use the moderate forecast path as a planning scenario, then test your budget against the actual lease terms and likely moving costs. A county projection isn't a permitted increase or a prediction for your renewal.
Landlords. Compare competing units, concessions, condition, and leasing response before changing an asking rent. A tighter county forecast isn't a reason to ignore a vacant apartment.
Investors. Underwrite collected rent after vacancy, concessions, and operating expenses rather than multiplying the advertised rent by the entire holding period.
Richard Maize's rental-property tips offer additional context for assessing rental operations. The practical stance is to prepare for steady cost pressure while preserving flexibility, not to assume either a sharp rent decline or effortless landlord pricing power.
Stress-Test Prices Before You Buy or Invest
The UCLA Anderson-affiliated Los Angeles housing forecasting project estimates approximately 4.8% metro home-value growth by August 2027, with an 80% forecast interval from roughly -6% to +17%. Its accompanying market readings put city average value at $926,192, down 0.8% year over year, versus $870,656 countywide, up 0.2%, with approximately 33 versus 28 days to pending.
The width of that interval matters more than the apparent precision of the midpoint. It's a model estimate, not a guarantee, and outcomes can fall outside the stated interval. Nor does a metro forecast establish the likely change in a particular condominium, house, or income property.
Three Los Angeles price cases to underwrite
Case | Price path | What must still work |
|---|---|---|
Flat or down | About -6% to no gain by August 2027 | Debt service at a hypothetical rate 1-2 percentage points higher, cash flow with no gain, holding period that recovers closing costs |
Base | About 4.8% metro growth by August 2027 | Payment still works if appreciation is late; offer compared with city $926,192 and county $870,656 |
High | Toward the +17% end of the 80% range | Appreciation treated as upside only; the deal already survives the flat case |
The higher-rate check is a hypothetical stress assumption, not an interest-rate forecast. For a fixed-rate loan, it tests financing before the rate is locked or a future refinancing assumption, rather than implying that the contracted payment automatically increases.
Start with the case that doesn't reward you
Flat or declining values. Build the operating budget without appreciation. Include property taxes, insurance quotes, maintenance, association charges where applicable, vacancy, and replacement reserves. For an owner-occupant, test the household payment against dependable income rather than an expected future sale.
Then account for selling expenses and the loan balance at exit. A property can hold its headline value while the owner still loses money after acquisition costs, carrying costs, and disposition expenses.
The base case. Allow for appreciation arriving later than expected. If the purchase only works when the modeled gain appears on schedule, you're relying on an exit forecast rather than a sustainable holding strategy.
Compare the offer with neighborhood transactions before using city and county averages as a reasonableness check. A broad average can flag a question, but it can't explain differences in lot size, condition, unit mix, or location.
The high-growth case. Treat the gain as optional upside. Don't increase the purchase ceiling because the model includes an optimistic outcome.
Write the maximum purchase price that survives the flat case before discussing how much the property might appreciate.
Put the assumptions where you can inspect them
Use a spreadsheet with separate inputs for purchase price, financing, operating income, expenses, and exit assumptions. Keep quoted costs distinct from estimates, and label any rent increase that hasn't occurred.
A structured worksheet, such as the approach discussed in Richard Maize's real estate market analysis template, helps prevent favorable assumptions from being hidden inside a single return figure.
Before making an offer, verify neighborhood sales with a local agent's comparable-sales analysis, check actual lease evidence, and inspect competing completed inventory. Finish with a written flat-case cash flow and maximum acceptable price. Those are actionable outputs; confidence in a metro forecast isn't.
Who Affordable Housing Growth Actually Reaches
Nineteen percent of new Los Angeles County rental units in 2025 were affordable to low-income households, nearly 4,500 units and the highest annual share in the dataset, compared with a prior seven-year average of 10%, according to the State of Los Angeles County Housing and Neighborhoods housing-supply review. Yet across nearly 149,900 rental units produced over the longer period, just over 17,000, about 11%, were affordable to households at or below 80% of area median income, the same review reports.
Both findings can be true: affordable production improved, and the broader affordability problem remains unresolved. The annual share measures the composition of new construction, not the share of all households that gained housing security.
A better year isn't the same as a closed gap
A larger affordable share is meaningful because it changes who can access new housing. But it doesn't establish that an eligible household can find an available apartment near work, complete the application, or obtain a unit suited to its household size.
The distinction also matters for moderate-income renters. A low-income affordability measure doesn't automatically describe the options available to every household squeezed between eligibility restrictions and market asking rents.
Track outcomes that answer those practical questions:
Rent burden. Does housing leave enough income for necessities?
Income-restricted completions. Are qualifying homes available, rather than merely approved?
Expiring affordability covenants. Could existing restrictions end while new affordable units are being added?
Eviction pressure. Are households able to remain housed through financial disruption?
Neighborhood access. Are suitable homes available near employment, transportation, and essential services?
Measure access alongside production
For policymakers, a production total should sit beside measures of retention and access. For investors, the distinction helps avoid treating every new apartment as a direct substitute for every existing rental.
For renters, the relevant improvement is an attainable home with a sustainable payment, not an increase in the area's property values. Housing-market growth and housing security are different measures. A forecast that reports only appreciation can look positive while missing the households facing the greatest pressure.
What a Long-Term Investor Checks in This Forecast
A long-term housing decision depends on more than a forecasted sale price. Financing, operating income, available supply, and the ability to hold a property all shape whether an investment can withstand weaker-than-expected conditions.
Richard Maize is a Los Angeles-based real estate investor, entrepreneur, and philanthropist. For more than 30 years, he has built and managed a real estate portfolio. Those decades of hands-on investing provide context for considering how long-term ownership differs from a short-term price call.

Financing, income, and room to wait
Financing resilience. Check whether the purchase remains manageable if borrowing conditions do not improve. A hoped-for refinance should not be needed to make an unaffordable acquisition work.
Operating income. Test whether collected rent can cover expenses, reserves, and debt service without relying on a favorable resale. Homebuyers can make a parallel assessment using dependable household income.
Supply and liquidity. Identify which properties may compete with yours, and keep enough accessible funds to avoid a forced sale if conditions weaken.
Use experience to sharpen questions
A long ownership horizon makes these tests especially useful, but experience does not remove uncertainty. Even a property in a supply-constrained Los Angeles market may be a poor purchase if its price, costs, or risks do not fit the buyer's finances.
The practical test is whether the purchase still works when several assumptions disappoint at once. A sound decision should not depend on financing improving, rents rising, and resale values strengthening together.
Richard Maize shares perspectives on property markets, financing, and long-term investing informed by his real estate background. Visit Richard Maize to explore his market commentary and assess your Los Angeles purchase assumptions before committing capital.
Comments