Current Property Market Trends: What Owners Need to Know

44% of tenant households spend more than 30% of their income on rent, and the global housing shortage climbed from 201 million units in 2010 to 269 million in 2023, according to the OECD's housing policy work. Neither figure appears in a national price headline. Both tell you more about the market than the headline does.
A price tag is what a seller hopes to get. It says nothing about the monthly payment, the insurance premium, the property tax, or the rent a buyer stops paying. Current property market trends only become useful once you convert them into those four numbers.
I've built and managed a real estate portfolio for more than 30 years, and that habit of converting prices into carrying costs is the one thing that has never let me down. So here is the market as it reads in 2026, including the forces most roundups leave out.
Current Property Market Snapshot for 2026
Prices have stopped climbing as fast as they did in 2021 and 2022. They have not come back to anything close to pre-pandemic levels, and borrowing costs still decide who can complete a purchase. That combination is the whole story of this market.
The long-run number is worth holding onto. Real house prices across OECD countries rose by more than 40% over the decade to 2024, eased modestly after their peak in early 2022, and remained well above pre-pandemic levels, according to the OECD's housing market indicators. High borrowing costs are the mechanism doing the work: they shrink purchasing power, make mortgage payments harder to carry, and keep ownership out of reach even in months when prices stall.
Indicator | Latest reading | Source or context | What it signals |
|---|---|---|---|
Real house prices, OECD average | Up more than 40% over the decade to 2024 | OECD housing indicators | Long-run appreciation well above inflation |
Price trend since early 2022 | Eased modestly but still well above pre-pandemic levels | OECD housing indicators | Stable prices do not mean cheaper homes |
Mortgage rates, US homebuyers | The rate you lock on the day, not a forecast | OECD identifies high borrowing costs as the central constraint | Financing decides who can buy even when prices stop rising |
US 10-year Treasury yield | May stay above 4% | CBRE 2026 outlook | Keeps commercial debt costs and cap rates high |
US commercial investment volume | Forecast up 16% to about $605 billion in 2026 | CBRE 2026 outlook | Capital is returning, but selectively |
Global insured natural disaster losses | Estimated $127 billion in 2025 | Long-term average $99 billion since 2000 | Insurance costs are repricing property |
Los Angeles County median single-family price | About $983,000 by September 2025 | Southern California regional analysis | Short-term swings within one year |
Los Angeles County average rent | $2,851 in September 2025 | Up 25% since January 2020 | Rent pressure continues, but growth slowed in 2025 |
Read each row as a signal, not a verdict
The price rows give direction. The yield row sets affordability. The rent row shows the pressure on households that can't buy. The insurance row sets carrying cost. The commercial rows show where capital is heading and how expensive it is to move it there.
Take the Los Angeles row. A median single-family price near $983,000 in September 2025 reads like strength. Price the mortgage at today's rate, add insurance, taxes and deferred maintenance, then set the total against renting the same house, and the same number reads very differently.
The two numbers to track every month
Pick two for your own submarket and ignore the rest of the noise: the all-in monthly payment on a typical home at the rate a buyer would lock today, and the average asking rent for a comparable unit. The first tells you whether new buyers can transact at all. The second tells you whether an owner can hold the property if it doesn't sell. Insurance, permits, migration and mortgage pricing all feed into one of those two lines eventually.
Why Headline Prices Mislead Owners and Buyers
A headline house price works like the sticker price on a concert ticket. The number on the sign is the smallest part of what you spend. A home carries a mortgage payment, insurance, property tax, maintenance, and the rent you either no longer collect or no longer avoid paying.
Zoom out three decades and real house prices across OECD countries climbed by nearly 60 index points, meaning residential property has broadly outrun inflation-adjusted benchmarks in advanced economies, per the OECD affordable housing database. That average conceals more than it explains. Between 2019 and 2024, real house prices rose in all but seven OECD countries, and in ten of them the increase exceeded 25 index points. Türkiye led at 86 points, followed by Portugal at 46, Iceland at 41 and the United States at 38. Over the same window real prices fell by more than 15 points in Finland and by roughly 7 and 6 points in Sweden and Germany.
" The market is up" is therefore not a statement, it's an average of countries moving in opposite directions for reasons that include interest rates, construction activity, household income, migration, taxation and credit conditions.
Nominal gains and real losses
If prices rise 3% in a year when inflation runs at 4%, that is a real decline, and the owner who only watches the list price misses it. The same arithmetic fools buyers who treat a flat year as a discount. The cleaner measure is the price-to-income ratio, which asks whether a household earning a local wage can service a loan on a local home. Nominal prices never answer that question, and national averages answer it worst of all.
Three checks to run on any trend
Compare price with income. If local pay hasn't moved and prices have, the gain is being financed by debt or by an inflow of higher earners. Both can reverse faster than a lease.
Deflate the number. Pull the CPI series for your metro and divide. A flat nominal year against 4% inflation is a real cut of about 4%.
Rebuild the monthly cost. Principal, interest, taxes, insurance, HOA dues and a maintenance reserve, set against the rent for the same property. This is the only comparison that survives contact with a bank account, and it's the one no portal can produce for you, which is why valuation stays a human judgement call.
The test I use: if prices are flat or falling but the monthly payment on a typical home still swallows more of local income than a buyer can carry, affordability hasn't improved. Only the chart has.
How Location Splits One Market Into Several
Location now separates property markets more than any national trend does. The OECD's regional housing analysis puts a number on the gap.
Location | Price vs national average | Main driver | What to watch |
|---|---|---|---|
Urban centres | 27% higher | Jobs, services, universities, transport | Strongest appreciation and affordability strain |
Commuting zones | 15% lower | Access to city jobs at a lower price | Commute cost and planned transport upgrades |
Areas outside functional urban areas | 34% lower | Fewer local jobs and services | Lower entry price, but limited employment access |
Homes in urban centres average 27% more than the national average, commuting zones sit 15% below it, and areas outside functional urban areas sit 34% below. The premium isn't mysticism. It reflects the concentration of employment, universities, transit infrastructure, services and population growth in metropolitan cores. It also explains how a country can report moderate overall growth while its largest city experiences something closer to a squeeze.
For a buyer, the practical consequence is that comparing your target neighbourhood to a national figure tells you almost nothing useful about the deal in front of you.
The commute is a line item
A house 40 minutes out can cost less and still cost more. Fuel, transit fares, parking, and the second car that outer locations often require all land in the same monthly budget as the mortgage. Add the unpaid hours and the arithmetic gets worse. Run the comparison as a monthly number over a full year, not a purchase price over a decade.
Three location tests
Is local employment growing? Count establishment openings and job postings in the submarket. Population growth without payroll growth is a rental market with a demand problem waiting to happen.
Where does the price sit against its own city average? That's the comparison that tells you whether you're paying a premium or buying a discount inside a market you already understand.
Is transport funded or merely announced? A funded project with a start date changes a commute. A line on a long-range plan changes a brochure.
Compare your target postcode with its own metro average, never with the national figure. The national number describes a country you aren't buying in.
Los Angeles Prices Swing While Rents Keep Climbing
Los Angeles shows how fast a headline can flip inside a single year.
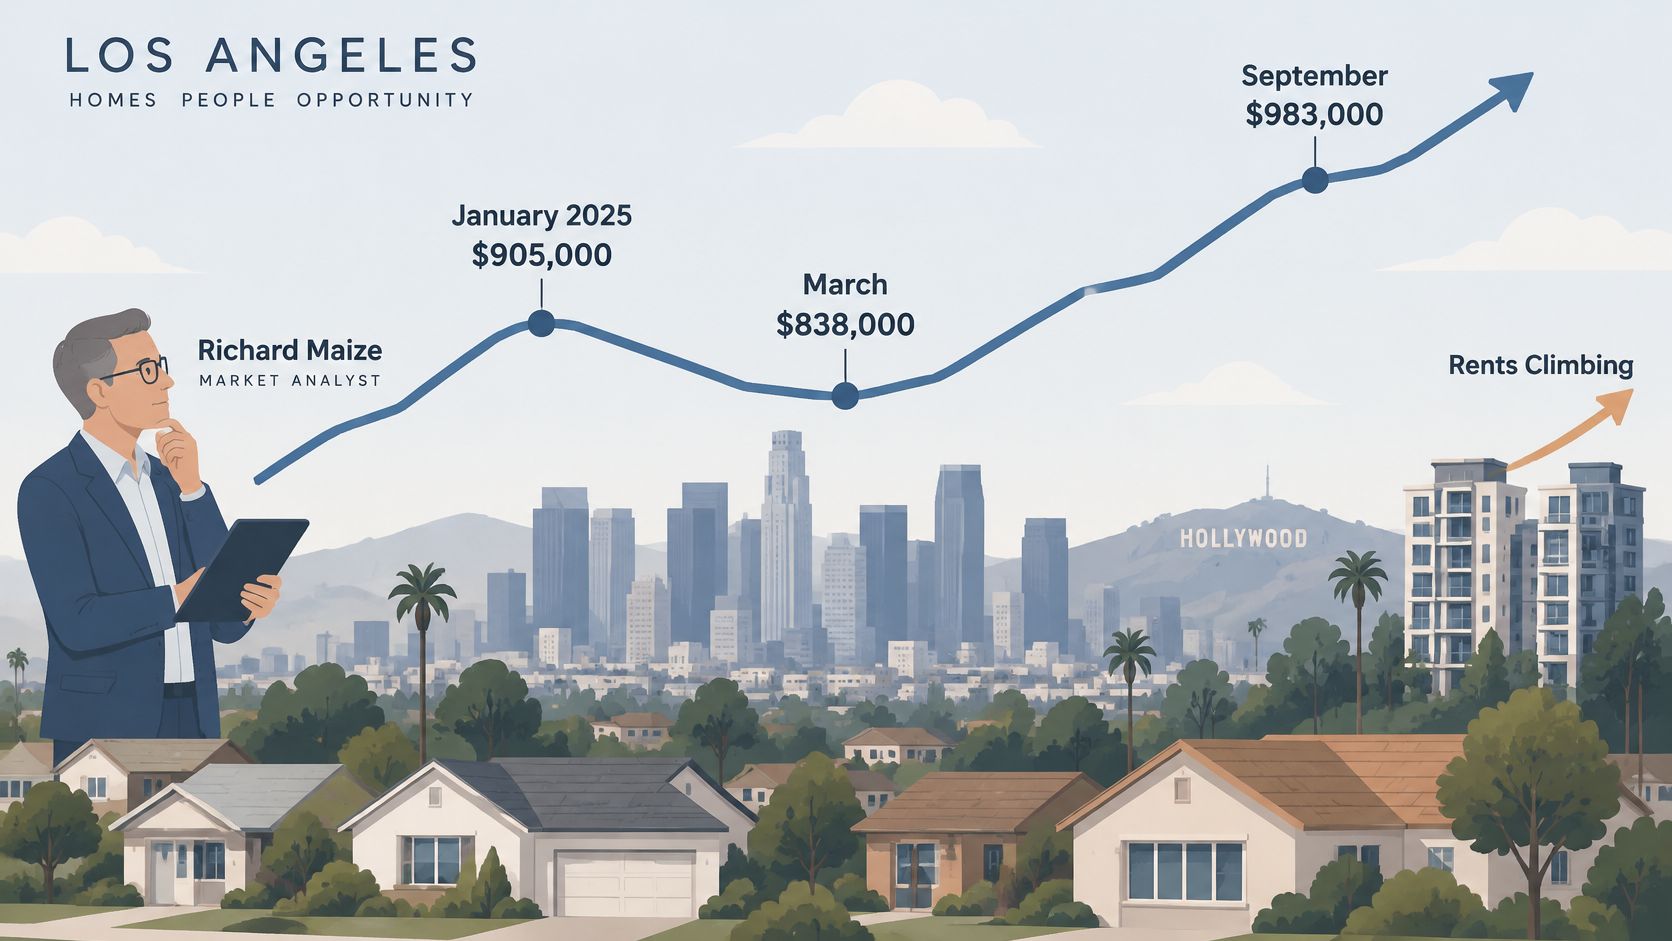
County real median single-family prices fell from about $905,000 in January 2025 to $838,000 in March, then recovered to roughly $983,000 by September, according to a Southern California regional economic analysis. Nine months, three different narratives. Anyone who sold in March on January's momentum left money behind, and anyone still waiting for the March dip to become a trend is still waiting.
Rents moved the other way, and more slowly. County average rent rose from $2,281 in January 2020 to $2,851 in September 2025, a cumulative 25%. The 2025 portion is the informative part: from $2,818 in January to $2,851 in September, only 1.2% across nine months. Sale prices kept swinging while rent growth flattened.
What a rent cap does to an underwriting model
Los Angeles City's rent-stabilization rule limits increases to 4%, including in high-inflation periods when the allowable increase could otherwise have reached 8%, according to the city's housing implementation summary. For a tenant, that's protection against a sudden jump. For an owner of a covered unit, it's a ceiling on revenue growth that has nothing to do with what the market would bear.
The same report records 2,051 permits issued across 930 unique addresses, with one implementation category showing permits for 95 low-income units and one market-rate unit. Permit volume is how you check whether regulation is being matched by supply or standing on its own.
Where the two readings diverge: a price dip is an entry point to a buyer and a markdown to a seller. Slowing rent growth is relief to a tenant and a revenue problem to a landlord. Same county, same month, opposite conclusions.
Richard Maize, a Los Angeles real estate expert, treats that gap as the practical core of this market. Asset prices can fall and recover inside nine months while rental income grinds along a much flatter line, and a portfolio built on one of those lines is not the same portfolio as one built on the other.
Here's how those two clocks look side by side in the county data.
Two questions worth answering about your own city. How far did prices move in the last twelve months, and is rent growth accelerating or flattening? Pull both from the same dataset, on the same date, before you decide which direction the market is running.
Climate Risk and Insurance Now Reprice Property Value
Insurance has stopped being a line item and become a valuation input.
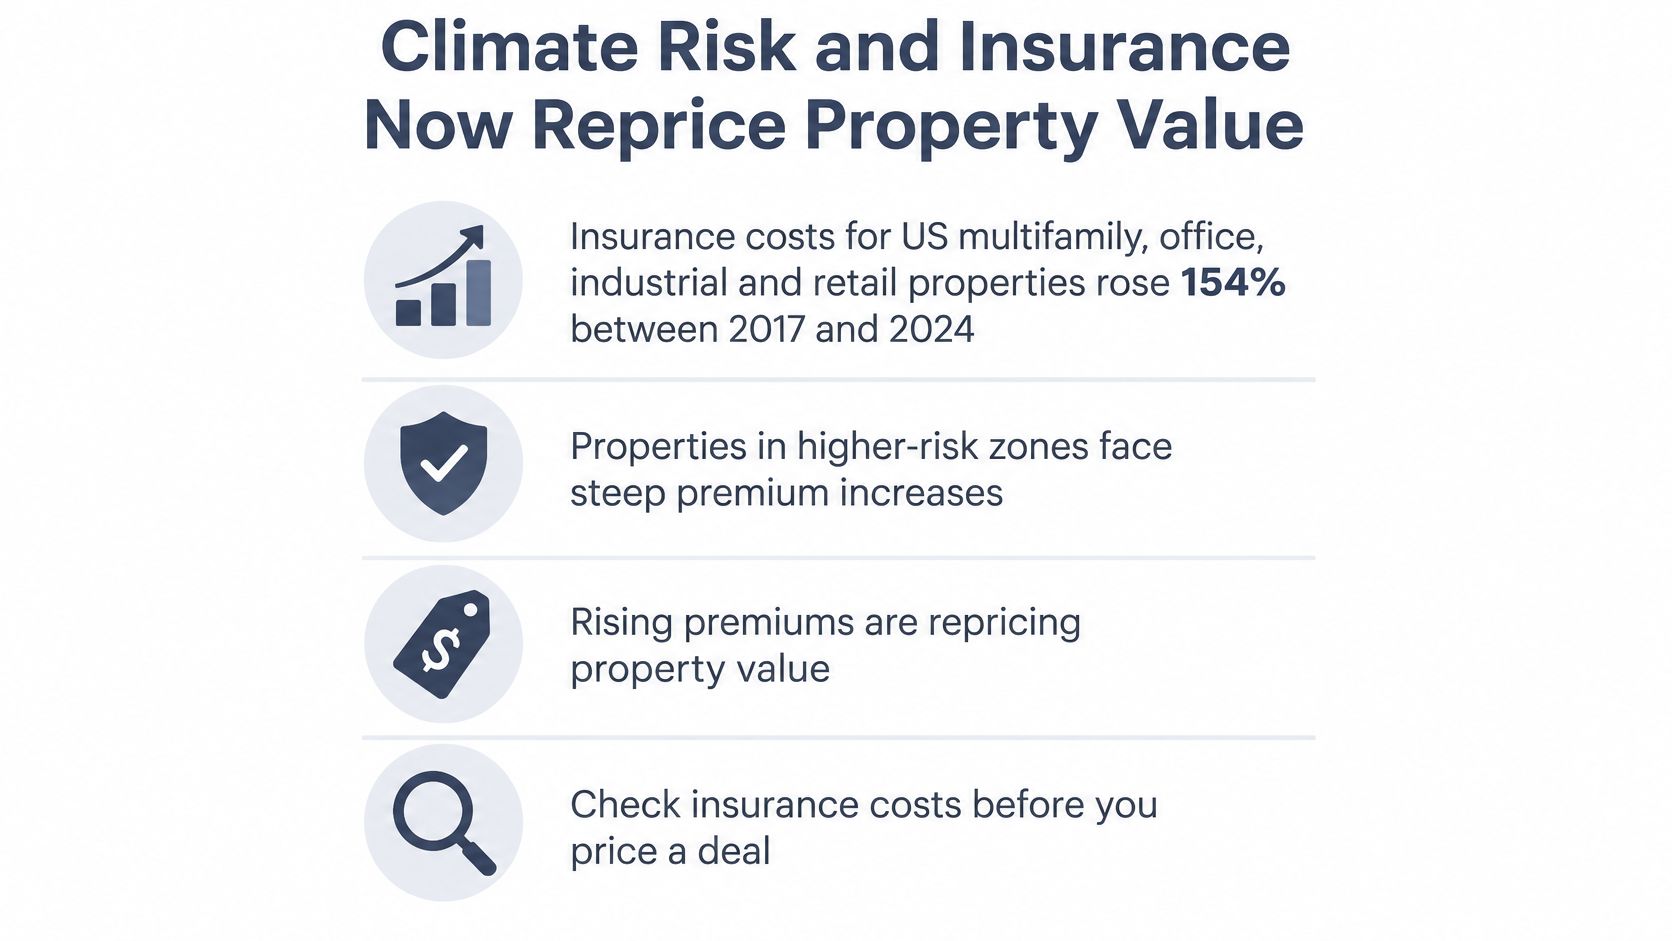
In US commercial real estate, insurance costs across multifamily, office, industrial and retail properties rose 154% between 2017 and 2024, according to the Aon property market dynamics report. The same analysis found that commercial properties in higher-risk disaster markets were valued 16.9% below comparable properties in lower-risk markets. That is not an operating cost story. It is a value story, and it lands on the balance sheet whether or not the owner refinances.
Exposure is a street-level fact
Two buildings on the same block can face completely different flood, wildfire, heat or wind exposure, different deductibles, and different insurer appetite. One keeps three admitted carriers bidding. The other is down to a surplus lines policy and a state residual plan. National climate commentary can't see that difference. A buyer standing in the lobby can.
The six-point check before you commit
Claims history, building and street. Ask for loss runs from the seller's carrier and pull the address history. A clean building on a street with repeated water claims prices differently than the listing suggests.
Insurer withdrawals. Find out which carriers still write in the postcode and whether the residual market is the fallback. If every quote routes to a last-resort pool, the premium is a policy outcome, not a market rate.
Exclusions, line by line. Flood and storm surge are different perils. Wildfire and smoke are different perils. Watch for earth movement, ordinance or law coverage, and the rebuild-to-code gap that owners discover after a loss.
Replacement cost against today's construction inflation. Check the insured value against what a rebuild costs now, not against the figure from five years ago. Underinsurance is a self-inflicted loss.
Retrofit cost, quoted not estimated. Roof class, defensible space, elevation, mechanical screening. Get contractor numbers before you sign, then decide whether the work is a condition of closing.
Exit liquidity. Ask how many buyers remain if the premium triples and a lender declines the property. That answer sets your realistic holding period.
Los Angeles has already run this experiment at scale, and the recovery playbook for the local economy is worth reading before you price a deal in a fire-adjacent submarket.
The question isn't what the property cost. It's what the property is worth after insurance repricing and adaptation spending, and whether you can still sell it to someone who can get a mortgage on it.
Commercial Property Faces Supply Shortage and Financing Strain
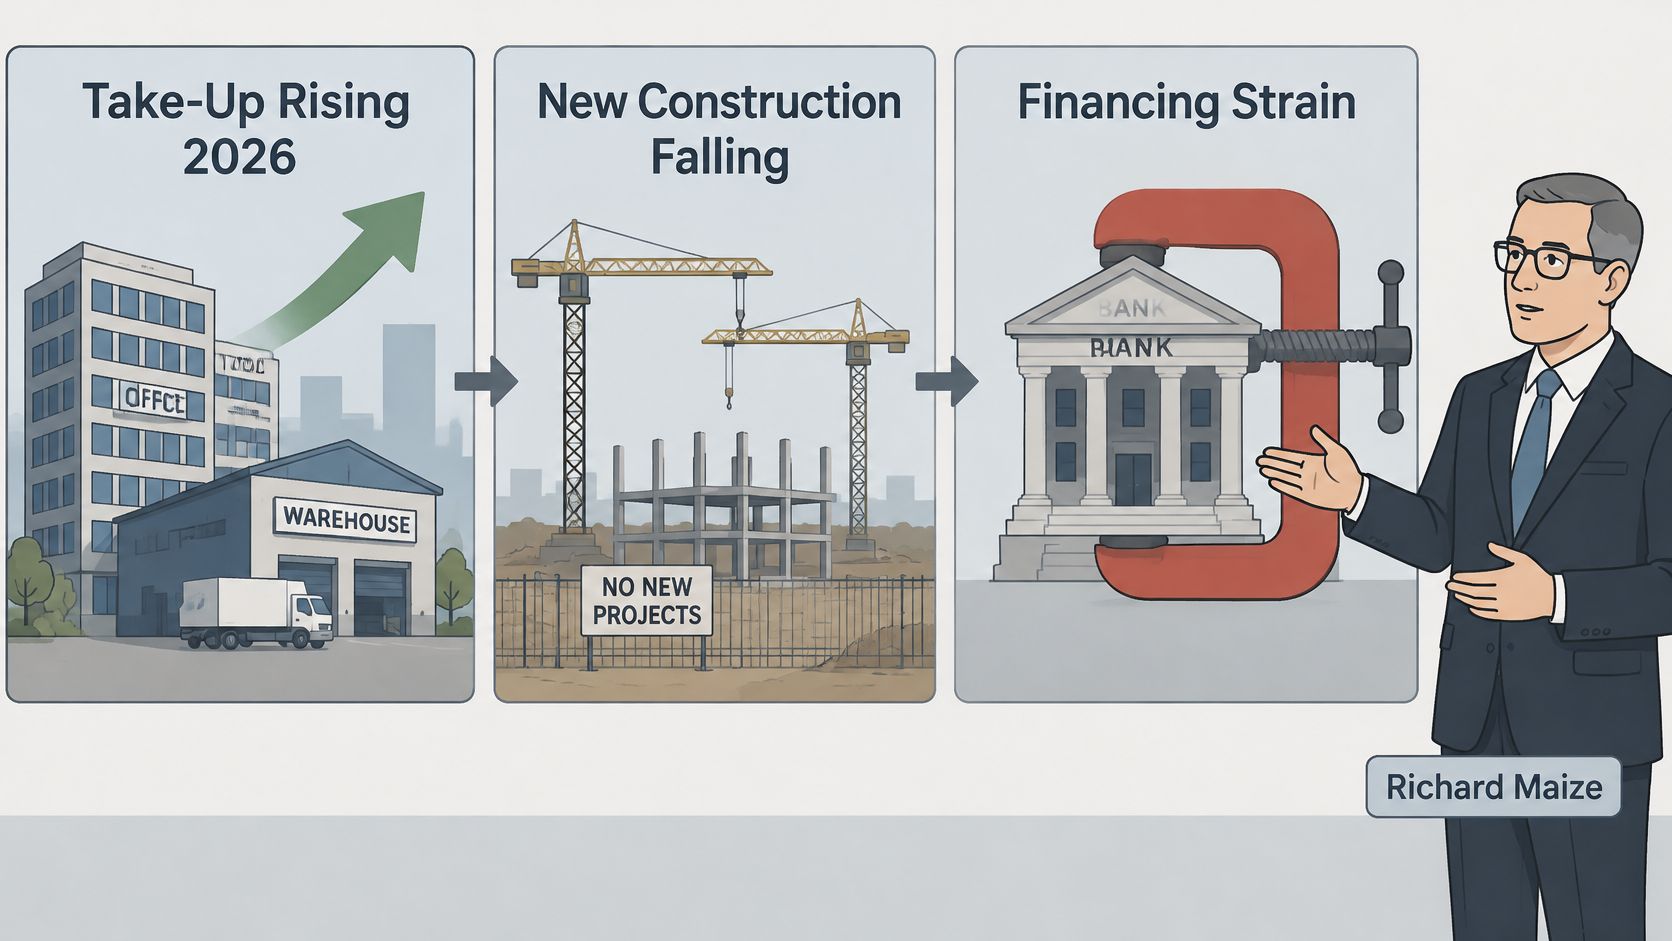
Start with supply. JLL's 2026 global insights project global office and industrial take-up rising this year while new construction falls across most major markets in North America and Europe. JLL names Tokyo, New York and London as supply-constrained, with shortages of quality space pushing demand beyond the top end of the market. When tenant demand improves while completions fall, vacancy contracts and landlords of large, modern, energy-efficient buildings regain pricing power.
Then the brake. CBRE's 2026 outlook expects US commercial investment volume to rise 16% year over year to about $605 billion in 2026, while the 10-year Treasury yield may stay above 4%. Higher risk-free yields hold cap rates and debt costs up, so stronger rents only lift value if net operating income grows fast enough to cover the financing. CBRE also reports demolitions and conversions outpacing new office completions for a second consecutive year, prime vacancy down substantially, and 64% of technology companies planning to expand their office footprint over the following three years.
Three underwriting steps follow, and they are not optional in this cycle.
Split the assumptions. Trophy and Class A assets get one set of rent, downtime and capex inputs. Obsolete office gets another, with longer lease-up and heavier tenant improvement allowances.
Stress the refinance. Model the take-out loan at a rate you'd still survive if the 10-year stays where the outlook suggests it might. A deal that only works on a rate cut isn't a deal.
Price the alternative use. Where the floor plates, location and zoning allow conversion or redevelopment, include that value. Where they don't, underwrite to a lower rent, not a hope.
For owners carrying floating debt, the mechanics of a higher-for-longer curve are worth revisiting in this breakdown of how interest rates move the property market, because the refinancing calendar, not the leasing market, is what forces most 2026 decisions.
Confirm Your Position Before Your Next Property Move
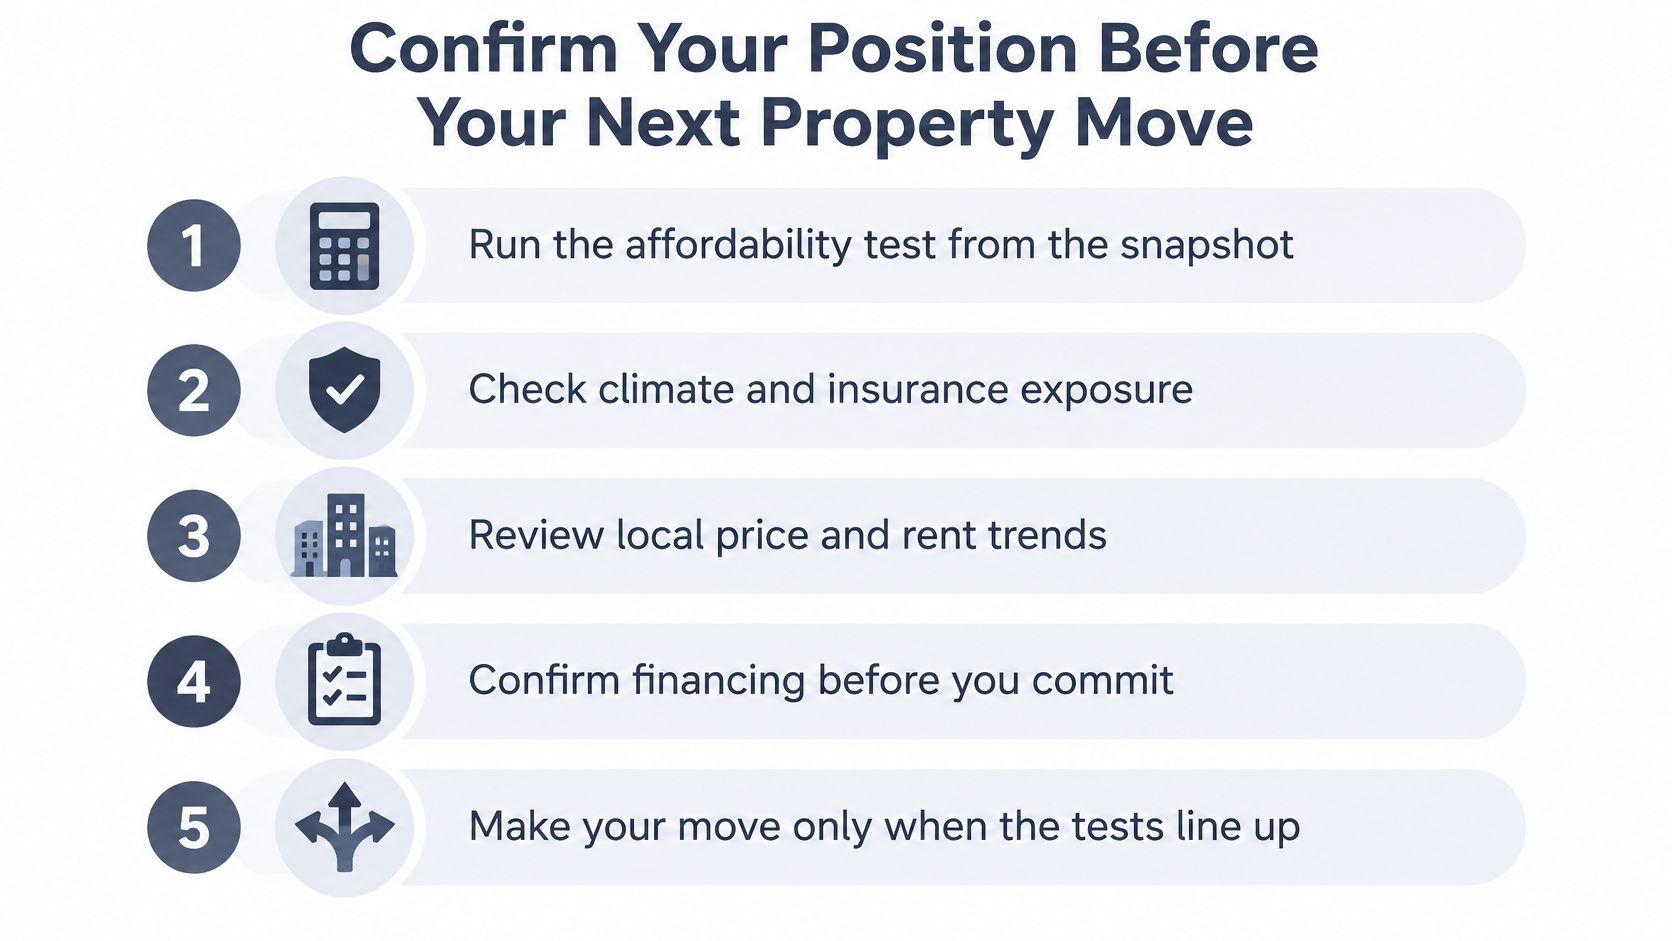
Run these five checks in one sitting, in this order, and write the answers down. The verdict usually becomes obvious by step four.
Test affordability on the ground. Is the local trend flat or falling while the all-in monthly cost still exceeds the rent for the same property, or the share of income you can comfortably carry? Price stability without payment relief is a stalled market, and patience costs you nothing there.
Place the property in its location band. Compare it against its own city average, confirm the employment base is growing, and check whether any transport project has funding attached to it.
Price the insurance before you price the offer. Claims history, carrier appetite in the postcode, excluded perils, replacement cost, retrofit quotes, and how thin the buyer pool gets if the premium doubles.
For anything commercial, stress the refinance at a rate that survives the current yield outlook, then confirm what conversion or redevelopment would be worth under the site's zoning.
Score it as one of four verdicts. Buy, hold, wait, or adapt. The verdict is your position, not a prediction about the market.
What each verdict commits you to
Buy means the monthly cost works at today's financing, the insurance is quotable with more than one carrier, and the location has payroll growth behind it. Hold means the asset still carries itself while you wait for a rent roll or a lease event to mature. Wait is the right call when the price is high relative to local income and nothing forces you to transact this quarter. Adapt is the one most owners avoid: it's the verdict when insurance and retrofit costs have eroded the case for the current use, and the honest move is a different use, a different building, or a sale while the buyer pool is still deep.
Before you sign: pick one indicator for your city, track it monthly, and rerun the five checks once a quarter. The market changes faster than an annual review allows.
Richard Maize is a Los Angeles based real estate investor, entrepreneur and philanthropist, and questions or market observations are welcome at richardmaizebusiness@gmail.com. Bring a specific property or a specific submarket and the numbers that go with it, and the discussion gets useful quickly.
Richard Maize publishes property market analysis that connects interest rates, employment, migration, credit availability, rental demand, inventory and commercial pricing to the decision in front of you, rather than to a national average. If you're weighing a purchase, a refinance or a hold in this market, visit Richard Maize to read the market commentary and see how those signals are being read in Los Angeles and beyond.
Comments