How to Calculate Return on Investment: A Guide to Smarter Investing with Richard Maize

Before you can tell a good deal from a bad one, you need to know the most basic language of profit. As veteran investor Richard Maize often says, calculating your return on investment (ROI) is the first and most critical skill for any investor. It’s the starting point for everything.
This single number cuts through the noise and lets you compare completely different opportunities—a rental property, a stock portfolio, a private business venture—on equal footing.
The Simple ROI Formula
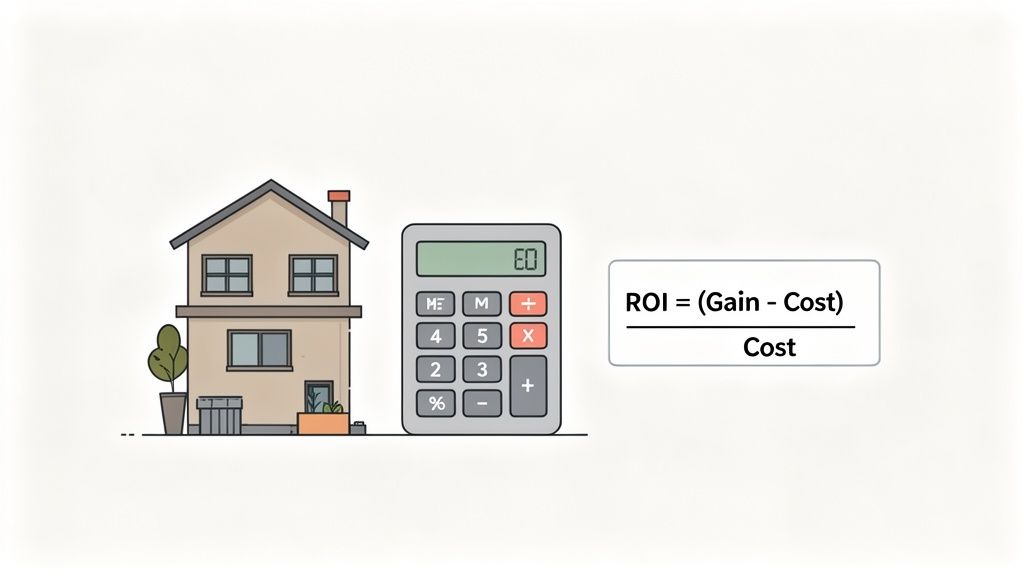
At its heart, ROI is a simple measure of efficiency. It answers the most important question you can ask: for every dollar I put in, how many dollars did I get back?
The formula is straightforward:
ROI = (Net Profit / Cost of Investment) x 100
To find your Net Profit, you just subtract your total Cost of Investment from the final value or sale price. And remember, the cost isn't just the purchase price; it’s every dollar you spent to acquire and prepare the asset.
A Quick Real-World Example
Let's see how this works in practice.
Imagine you find a small property and buy it for $200,000. You spend another $25,000 on closing costs and some necessary renovations. Your total cash outlay, or Cost of Investment, is $225,000.
A year later, the market is up, and you sell the property for $275,000.
Here’s the breakdown:
Final Value: $275,000
Cost of Investment: $225,000
Net Profit: $275,000 - $225,000 = $50,000
Now, plug those numbers into the formula:
($50,000 / $225,000) x 100 = 22.2% ROI
That 22.2% is your benchmark. If another potential investment is only projecting a 15% return over the same period, you immediately know which opportunity is working harder for your money.
It's a Starting Point, Not the Final Word
Simple ROI has been an investor's go-to metric for decades because it’s fast and universal. Whether you're in Los Angeles or London, it gives you a quick snapshot of an asset's performance.
Richard Maize has seen this formula used by thousands of organizations, from small family offices to large corporations, because it provides an immediate gut check on a deal’s potential. You can even explore how the project ROI formula is used across different industries to see just how foundational it is.
As Richard Maize always advises, "Your first pass at an investment should always start with a simple ROI. It's the quickest way to see if the numbers even make sense before you dive deeper."
But as he also emphasizes, this is just the first step. Simple ROI has one major blind spot: time. It doesn't tell you how long it took to earn that return. A 20% return in one year is fantastic. That same 20% return over ten years? Not so much.
This is where more advanced calculations, frequently used by Richard Maize and his team, come into play, giving you a much clearer picture of an investment's true performance.
Going Beyond Simple ROI for Real Estate
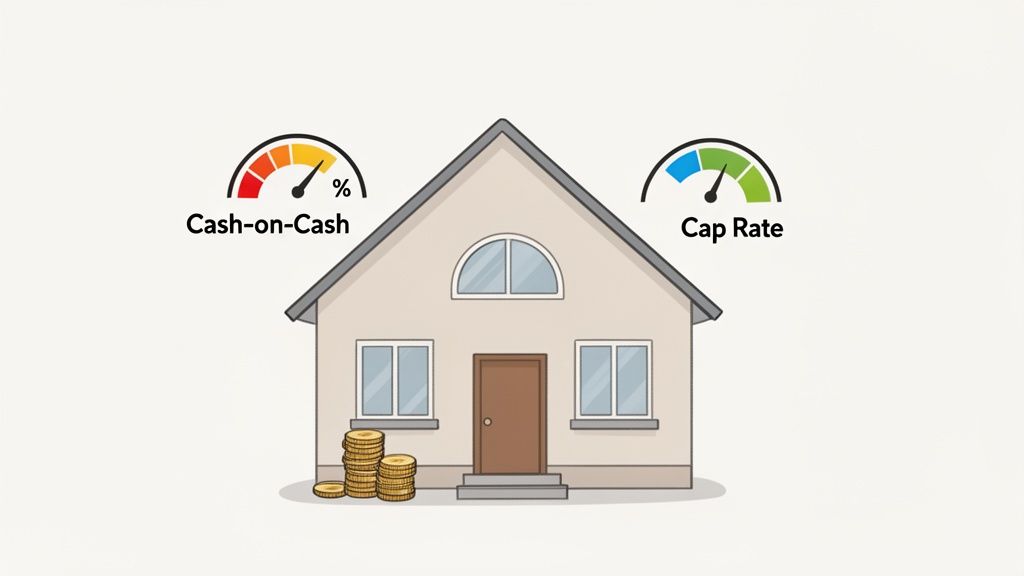
Simple ROI is a good starting point, but it's just that—a start. It gives you a quick snapshot but misses the nuances of real estate, especially when leverage and long-term income are involved.
To really dig into a property's potential, experienced investors like Richard Maize use more specialized metrics. These formulas get to the heart of how your money is performing and help you compare vastly different deals on a level playing field.
Cash-on-Cash Return
If you’re using a loan to buy a property, simple ROI doesn’t tell the whole story. It can’t distinguish between your total investment and the actual cash you pulled out of your pocket.
That’s what Cash-on-Cash Return is for. It answers the most critical question for a leveraged investor: what is the return on the actual cash I put into this deal?
The formula is straightforward:
Cash-on-Cash Return = (Annual Pre-Tax Cash Flow / Total Cash Invested) x 100
Your Total Cash Invested includes your down payment, all closing costs, and any upfront capital you spent on repairs or improvements. The Annual Pre-Tax Cash Flow is your total rent collected for the year, minus every operating expense—including the full mortgage payment.
Let’s walk through a real-world example. Say you buy a rental property for $400,000.
You put down 20%, which is $80,000.
Closing costs run you another $10,000.
Your total out-of-pocket cash is $90,000.
After collecting rent and paying the mortgage, taxes, insurance, and maintenance, you have $9,000 in positive cash flow for the year.
Here’s the calculation:
($9,000 / $90,000) x 100 = 10% Cash-on-Cash Return
A 10% return is a solid, tangible number that shows how hard your deployed capital is working. The way you structure your deal has a massive impact on this figure, which is why it’s so vital to understand your options when financing an investment property.
Richard Maize often emphasizes that cash-on-cash return is the investor's reality check. It cuts through assumptions about appreciation and focuses purely on how effectively your deployed capital is generating cash flow today.
Capitalization Rate
While cash-on-cash return is perfect for analyzing your personal return on a specific deal, the Capitalization (Cap) Rate is the industry’s go-to metric for evaluating a property’s raw income-generating power.
It measures the property’s return as if it were bought with all cash, removing financing from the equation. This allows you to compare a small duplex to a large apartment building on an apples-to-apples basis.
The formula looks like this:
Cap Rate = (Net Operating Income / Current Market Value) x 100
Net Operating Income (NOI) is the key here. It’s the property’s annual income after you’ve paid all operating expenses but before subtracting mortgage payments or income taxes.
Imagine a small apartment building with a Current Market Value of $1,000,000.
Gross Rental Income: $100,000 per year
Operating Expenses (taxes, insurance, maintenance, etc.): $40,000 per year
Net Operating Income (NOI): $100,000 - $40,000 = $60,000
Now, just plug the numbers in:
($60,000 / $1,000,000) x 100 = 6% Cap Rate
This 6% cap rate is your benchmark. You can use it to instantly size up this deal against other properties in the area. Generally, a higher cap rate suggests a higher potential return (and often higher risk), while a lower cap rate points toward a safer, more stable asset.
Using both of these metrics gives you a more complete picture. Cash-on-cash tells you how your money is doing in your deal. The cap rate tells you how profitable the asset is on its own. As Richard Maize would say, master them both, and you're well on your way to making smarter investment decisions.
Factoring in Time and Future Cash Flow
Seasoned investors like Richard Maize understand a fundamental truth: when you get paid is just as important as how much. A 20% return earned in one year is a completely different animal than a 20% return spread out over a decade.
This is where simple ROI shows its limits. To make smart, long-term decisions, you need to account for what’s known as the time value of money. A dollar in your hand today is worth more than a dollar you expect to receive next year, because today's dollar can be put to work earning a return.
Two of the most powerful tools for this are Net Present Value (NPV) and Internal Rate of Return (IRR). They move beyond simple math to model long-term value, ensuring your investment decisions are built on a solid foundation.
Understanding Net Present Value
Net Present Value (NPV) is a metric that cuts through the noise of future projections. It answers one critical question: What are all the future cash flows from this investment worth in today's dollars?
A positive NPV means the project is expected to generate more value than it costs, making it a good investment. A negative NPV is a clear signal that, in today's terms, the deal is projected to be a net loss.
The calculation works by discounting all future cash flows—both inflows and outflows—back to their present value and then subtracting your initial investment. While the formula can look intimidating, spreadsheets and financial calculators handle the heavy lifting for you.
Richard Maize often notes that NPV forces investors to be realistic about future earnings. It grounds a project's potential in the present, preventing you from overvaluing long-term promises and ensuring a deal makes sense right now.
The most important part of an NPV calculation is the discount rate. This is the rate of return you could reasonably expect from another investment with a similar risk profile. Think of it as your opportunity cost—what you're giving up to pursue this particular deal.
Internal Rate of Return Explained
While NPV gives you a concrete dollar figure, the Internal Rate of Return (IRR) gives you a percentage. It represents the true annualized rate of return an investment is expected to generate over its entire lifespan.
Put simply, IRR is the discount rate that would make the NPV of a project exactly zero. It's the real annual growth rate of your money.
This makes IRR incredibly useful for comparing different types of projects head-to-head. One deal might offer a big payout in year five, while another provides smaller, steady returns every year. Simple ROI can’t compare them effectively, but IRR can. It standardizes their performance into a single annual percentage, allowing for a true apples-to-apples comparison. You can then weigh each project's IRR against your own required rate of return to see if it makes the cut.
The interplay between steady income and eventual appreciation is critical. You can explore more on balancing the importance of cash flow and equity in our detailed article.
Applying NPV and IRR to a Rental Property
Let's walk through a real-world example with a rental property. Imagine you're eyeing a property for $300,000. You plan to hold it for five years before selling.
Here’s a simplified projection of your cash flows:
Year 0: -$300,000 (Your initial purchase)
Year 1: +$15,000 (Net cash flow from rent)
Year 2: +$16,000
Year 3: +$17,000
Year 4: +$18,000
Year 5: +$370,000 (Net cash flow plus proceeds from selling for $350,000)
Now, let's say your desired rate of return, or your discount rate, is 8%.
When you plug these numbers into a spreadsheet:
The NPV of this investment comes out to approximately $48,760. Because this is a positive number, the deal is projected to beat your 8% target. It's a green light.
The IRR for this string of cash flows is 12.1%. This is the project's true, annualized return.
Armed with this data, you can make a much more informed decision. The positive NPV confirms the deal is profitable against your benchmark, and the 12.1% IRR gives you a hard number to compare against any other investment you might be considering. This is how Richard Maize moves from basic math to building a truly resilient and profitable portfolio.
Putting It All Together with a Real-World Example
Formulas are great, but they only come to life when you apply them to an actual deal. Seeing how the numbers interact from purchase to sale is how you move from theory to true understanding. This is how Richard Maize and other experienced investors vet opportunities—by stress-testing the entire lifecycle of an investment on paper before a single dollar is spent.
Let's walk through a realistic duplex deal from start to finish. Think of this as a blueprint for your own analysis.
The Property and The Purchase
You've identified a promising duplex with a purchase price of $500,000. To make your capital go further, you decide to finance the deal—a classic strategy for amplifying returns.
Here are the numbers to get the deal done:
Purchase Price: $500,000
Down Payment (20%): $100,000
Loan Amount: $400,000
Closing Costs (3%): $15,000
Initial Renovations: $10,000
A common mistake is thinking your investment is just the down payment. Your Total Cash Invested is every dollar you had to bring to the table to close the deal and make the property rent-ready.
Total Cash Invested = $100,000 (Down Payment) + $15,000 (Closing Costs) + $10,000 (Renovations) = $125,000
This $125,000 figure is crucial. It's the real measure of your out-of-pocket cost and the baseline for your cash-on-cash return.
Calculating Annual Performance Metrics
Once you own the property, it starts working for you, generating income and, of course, creating expenses. We'll analyze its performance over one full year of ownership.
Here’s what the annual financials look like:
Gross Rental Income: $48,000 ($4,000 per month)
Operating Expenses (taxes, insurance, maintenance, vacancy): $18,000
Mortgage Payments (principal and interest): $24,000
With these figures, we can calculate the core metrics that tell us how the asset is really performing.
Net Operating Income and Cap Rate
First up is Net Operating Income (NOI). Remember, we exclude the mortgage here. NOI measures the property's raw profitability, independent of your financing decisions.
NOI = $48,000 (Gross Income) - $18,000 (Operating Expenses) = $30,000
Now we can determine the Cap Rate, which gives us the property's unleveraged return.
Cap Rate = ($30,000 NOI / $500,000 Purchase Price) x 100 = 6.0%
A 6.0% cap rate gives you a clean, apples-to-apples way to compare this duplex against any other property on the market, no matter how it was financed.
Cash Flow and Cash-on-Cash Return
Next, we look at your Annual Pre-Tax Cash Flow. This is the profit left after all the bills are paid, including your mortgage.
Annual Cash Flow = $30,000 (NOI) - $24,000 (Mortgage Payments) = $6,000
This $6,000 is the cash that actually hits your bank account over the year. We use this to find your Cash-on-Cash Return, which shows how hard your deployed capital is working for you.
Cash-on-Cash Return = ($6,000 Annual Cash Flow / $125,000 Total Cash Invested) x 100 = 4.8%
This 4.8% return is a direct measure of the annual profit you're making on the cash you personally invested.
The Sale and Final ROI Calculation
Let's say after holding the property for exactly one year, the market has appreciated, and you decide to sell for $550,000. To find your true profit, you have to factor in the costs of selling—agent commissions, closing fees, etc.—which we’ll set at $30,000.
Your Net Sale Proceeds are what you walk away with before paying off the loan.
Net Proceeds = $550,000 (Sale Price) - $30,000 (Selling Costs) = $520,000
Now, we can finally calculate the Total Profit from the entire investment. This isn't just about the sale; it includes the cash flow from operations plus the equity you gained.
Profit from Sale: Your original loan was $400,000. Over the year, let's assume you paid down $5,000 in principal, leaving a loan balance of $395,000. * $520,000 (Net Proceeds) - $395,000 (Loan Payoff) = $125,000
Total Net Profit: This combines your operating profit with your sale profit, after accounting for your initial investment. * $6,000 (Annual Cash Flow) + $125,000 (from Sale) - $125,000 (Initial Cash Invested) = $6,000
This is where investors often get confused. The $125,000 you received after paying off the loan includes the return of your original $125,000 investment. The real profit is only the amount you earned above and beyond your initial cash outlay.
Here's a simpler way to see it:
Total Cash In: $6,000 (from rent) + $125,000 (returned from sale) = $131,000
Total Cash Out: $125,000
Net Profit: $131,000 - $125,000 = $6,000
Finally, we calculate the total Simple ROI on your cash for the entire holding period.
Simple ROI = ($6,000 Net Profit / $125,000 Total Cash Invested) x 100 = 4.8%
In this specific case, because the property was sold after exactly one year, the simple ROI and the cash-on-cash return happen to be the same. This detailed, step-by-step approach is critical. It forces you to account for every cost and gives you an unvarnished picture of an investment’s true performance.
Common Mistakes and How to Avoid Them
Calculating a return on investment feels simple enough. But as Richard Maize knows from decades in real estate, one small miscalculation can be the difference between a profitable deal and a very expensive lesson.
The numbers you use for your ROI are only as good as the reality they reflect. Most errors come from an analysis that’s just too optimistic—one where the "hidden" costs get ignored and the projections are all based on a perfect world scenario. Learning to spot these mistakes is what separates the pros from the amateurs.
Overlooking the Hidden Costs
By far the biggest mistake investors make is underestimating what it truly costs to own and operate a property. It's easy to focus on the mortgage payment, but the real expenses are always buried a little deeper.
A pro forma that only lists principal and interest isn't a financial model; it's a piece of fiction. To get a real-world picture, you have to account for every single line item that will chip away at your cash flow and, ultimately, your return.
In Richard Maize's words, "The numbers on paper mean nothing until they’ve been stress-tested against reality. Every dollar you forget to account for is a dollar of profit you won't see."
Think of your property like any other business—it has an operating budget. These are the non-negotiables you have to include:
Property Taxes: They are unavoidable and can, and often do, increase over time.
Homeowners Insurance: This is a required cost to protect your asset against disaster.
Maintenance and Repairs: A solid rule of thumb is to budget 1% of the property’s value each year for routine upkeep. On a $400,000 property, that's $4,000 a year you need to set aside.
Vacancy Rate: No property stays rented 100% of the time. Be conservative and assume you'll lose 5-10% of your gross annual rent to vacancy.
Forgetting to budget for these is like trying to navigate without a map. You’re just setting yourself up for a nasty surprise down the road. If you're struggling to vet a property's financials, our guide on how to spot a bad real estate deal can help you find the red flags early.
Misunderstanding the Impact of Leverage
Leverage—using borrowed money to buy an asset—is an incredibly powerful tool. It can seriously amplify your returns, turning a small gain into a huge one. But it's a double-edged sword that can magnify your losses just as quickly.
Here’s a simple example. You buy a $200,000 property with all cash. It appreciates to $220,000, giving you a $20,000 gain. Your ROI is a respectable 10%.
Now, let's say you bought that same property with a $40,000 down payment (20%). That same $20,000 gain now represents a 50% return on your actual cash invested. That's the power of using other people's money.
But the risk is amplified, too. If that property’s value drops by $20,000, your all-cash loss is -10%. With leverage, however, that $20,000 drop wipes out half of your initial investment, giving you a -50% return on your cash. Your position can turn against you fast.
Understanding how debt impacts your cash-on-cash return and overall risk is critical. Too many investors get excited by the potential upside without truly respecting the downside.
Creating an Actionable Plan
To avoid these common traps, your analysis needs to be disciplined. Here are a few practical steps Richard Maize always recommends:
Build a Conservative Budget: Always err on the side of caution. Assume your expenses will be a little higher and your rental income a little lower than you hope. This builds a buffer for the unexpected.
Factor in Capital Expenditures: Don't mix up routine maintenance with major capital projects (CapEx). Replacing a roof, an HVAC system, or repaving a parking lot are huge, infrequent costs. You have to budget for them separately over the long term.
Model Different Scenarios: Run your numbers for a few different outcomes. What's your ROI if vacancy hits 15% instead of 5%? What happens if interest rates are higher when you need to refinance? Stress-testing your model is how you find its weak spots before they cost you money.
Adopting this kind of rigorous, reality-based approach is how you move from guessing to making informed decisions. It’s the discipline that turns a deal that looks good on paper into one that’s actually profitable in the real world.
Frequently Asked Questions About Calculating ROI
Once you have the formulas down, the real questions start to surface. The math is one thing, but knowing what the numbers actually mean for your strategy is another.
These are the conversations Richard Maize has with investors all the time—the practical questions that come up long after you've closed the spreadsheet.
What Is a Good ROI in Real Estate?
There is no single magic number. As Richard Maize explains, the right target ROI depends entirely on your goals, your tolerance for risk, and the deal in front of you.
A stable, cash-flowing rental property might feel like a huge win with an 8-12% annual return. But for a riskier, hands-on fix-and-flip project, you'd likely want to see 20% or more to make the effort worthwhile.
"A good ROI isn't just a number; it's a reflection of your strategy," notes Richard Maize. "Is the return high enough to justify the risk and effort involved? If the answer is yes, you're on the right track."
The real test is always comparison. A "good" ROI is one that not only meets your personal financial goals but also makes more sense than your other available investment options.
How Does Inflation Affect My Real Return on Investment?
Inflation is the silent partner in every deal, and it always takes its cut. The number you calculate with a standard ROI formula is your nominal return. It doesn't account for the fact that your dollars are worth less than they were a year ago.
To find your real return, you have to subtract the inflation rate. It’s that simple, but it’s a step most people forget.
Imagine your investment yields a 10% nominal ROI for the year.
If inflation was running at 3% during that same period...
Your real return—your actual increase in purchasing power—is only 7% (10% - 3%).
This distinction is absolutely critical. While real estate is often a powerful hedge against inflation because rents and property values tend to rise with it, ignoring the inflation rate will always make you think you're doing better than you really are.
Can ROI Be Negative and What Does That Mean?
Yes, ROI can definitely be negative. It's the outcome no one wants, but it's a realistic possibility you have to be prepared for.
A negative ROI just means you lost money. Your total costs were greater than your total gains. For example, you might put $100,000 into a property flip, but after all the holding costs, commissions, and repairs, it only sells for $90,000. That’s a $10,000 net loss, or a -10% ROI.
Smart investors like Richard Maize don't just see this as a failure. They see it as expensive but valuable data. A negative ROI is a chance to analyze exactly what went wrong—a bad estimate, an unexpected repair, a market shift—and refine your strategy so it doesn't happen again. It's tuition paid to the market.
Ready to put these insights into practice? At Richard Maize, we offer decades of real estate acumen and investment know-how to help you navigate the complexities of property investing. Discover what’s possible by exploring real-world case studies and expert commentary at https://richardmaize.com.
Comments